Gold rebounded on weak non-farm payroll data, but short-term price action remains a battle between bulls and bears.
2026-07-03 16:54:25
On Friday (July 3), spot gold traded within a range near its two-week high during the European session, consistently remaining below the key psychological level of $4,200 and failing to break through effectively. This rebound from its lows has lasted for three trading days, with bullish sentiment in the market rising across the board since the release of the US June non-farm payroll data, and gold is poised for its first weekly gain in five weeks.

Looking back at the complete logic behind this round of gold price increases, the core driver came from the significant weakening of the US labor market, the market's downward revision of the Fed's interest rate hike expectations this year, and the simultaneous weakening of the dollar, which provided valuation support for non-yielding gold. However, multiple factors, such as geopolitical risk aversion diverting dollar buying, liquidity contraction due to the US Independence Day holiday, and inflation data remaining high, have continued to suppress the upside potential of gold prices. In the short term, there is a significant divergence between bulls and bears, and the future trend will still require guidance from multiple key data and Fed speeches.
US jobs data fell far short of expectations, significantly dampening expectations for a Federal Reserve rate hike.
The core trigger for this substantial rebound in gold prices was the unexpectedly weak US non-farm payrolls data for June, released on Thursday evening. This employment report fully signaled a weakening labor market, completely reversing the market's previous hawkish pricing in interest rate hikes.
The market had previously expected the U.S. to add 110,000 non-farm payroll jobs in June, but the actual figure was only 57,000, just half of the expected value and significantly lower than market expectations. Not only did the monthly job growth figure fall sharply, but the Bureau of Labor Statistics also revised down the employment data for the previous two months, with a cumulative reduction of 74,000 jobs in April and May. Among them, the number of jobs in May was revised from the initial value of 172,000 to 129,000. The downward revision of employment data for two consecutive months proves that the U.S. job market continues to cool down and the momentum of economic expansion continues to slow down.
A common misconception in the market is that while the unemployment rate has slightly fallen to 4.2%, seemingly indicating positive employment data, this does not necessarily reflect a strengthening economy. The core reason for the decline in the unemployment rate is a lower labor force participation rate, meaning fewer people are actively seeking work, leading to a contraction in the labor supply and thus suppressing the unemployment rate. This is a typical signal of weak employment and does not demonstrate the resilience of the US economy. Coupled with weakening US wage data and slower growth in household income, market concerns about persistently high inflation have also eased.
Following the release of the employment data, market expectations shifted dramatically. Before the data release, the market was betting on a 66% probability of a 25 basis point rate hike by the Federal Reserve in September; after the non-farm payroll data was released, this probability dropped to 54%. Previously, the mainstream market view was that the Fed would start raising rates as early as September, but most trading institutions have now revised their judgments, believing that the Fed will postpone its rate hike until December, with some trading models even predicting that the Fed's rate hikes throughout 2026 will be only 0 to 1 percentage point.
Gold is a non-interest-bearing asset. When market expectations for interest rate hikes rise and US Treasury yields increase, the opportunity cost of holding gold increases significantly, and funds tend to flow out of gold and into interest-bearing assets such as the US dollar and US Treasury bonds. Conversely, when expectations for interest rate hikes cool and US Treasury yields decline, the opportunity cost of holding gold decreases, and funds flow back into the precious metals market. Coupled with the continued weakening of the US dollar index due to expectations of interest rate cuts, falling to a two-week low, gold, priced in US dollars, naturally gained direct upward momentum. After the data release, gold prices surged by more than 2% in a single day, reaching a high of $4179, a new high since June 23. August gold futures followed suit, showing a clear rebound.
In addition, the continued gold purchases by central banks worldwide provide a stable long-term demand for gold. Even if short-term market fluctuations occur, the continued increase in gold reserves by central banks can offset temporary selling pressure, building a long-term bottom support for gold prices and preventing a deep correction. This is also a crucial underlying support that has enabled the current rebound to last for three days. Meanwhile, the continued decline in international crude oil prices further weakens the risk of rising inflation, indirectly reducing the necessity for the Federal Reserve to tighten monetary policy, creating a confluence of multiple positive factors.
Multiple negative factors limit upside potential, making a one-sided surge in gold prices unlikely.
Despite the strong positive catalyst from the employment data, the market did not break out of its one-sided bullish trend, with the $4,200 level continuing to act as strong resistance, mainly due to three negative factors.
First, ongoing geopolitical conflicts are diverting safe-haven funds, supporting a stronger dollar and limiting gold's gains. Recent tensions between the US and Iran have escalated, with media reports indicating US officials are concerned about Israel's plans to assassinate senior Iranian negotiators during indirect US-Iran peace talks. The US believes such actions would directly destroy peace negotiations and ignite a new round of conflict in the Middle East. Meanwhile, the Iranian military has publicly stated a strong stance, indicating that if the US interferes with shipping in the Strait of Hormuz, Iran will retaliate swiftly and decisively. Middle East geopolitical risks possess strong safe-haven characteristics, and the US dollar is a traditional core safe-haven asset. Once market panic intensifies, funds will prioritize flowing into the dollar, pushing up the dollar index and consequently suppressing gold's upward potential, creating a unique hedging scenario where gold and the dollar rise in tandem, thus limiting the magnitude of gold price increases.
Second, US inflation remains high, and the Federal Reserve's core policy objectives have not yet been achieved, making a complete shift to easing unlikely. It's important to clarify that a single weak employment report is insufficient to fundamentally change the Fed's overall monetary policy stance. Currently, overall US inflation remains above 4%, and controlling inflation remains the Fed's top priority. Even with weakening employment, as long as inflation doesn't decline significantly, the Fed will not easily abandon its rate hike plan. The market should not overly bet on continued dovish expectations, as profit-taking by bullish investors is suppressing gold prices. If subsequent inflation data shows further increases, market expectations for rate hikes will rebound rapidly, immediately putting downward pressure on gold prices.
Third, the US Independence Day holiday led to a significant contraction in market liquidity, amplifying price volatility while suppressing trend-following movements. On Friday, the US market was closed for Independence Day, with trading in US stocks and bonds suspended, resulting in global gold market trading volume far below normal levels. Insufficient liquidity has two main effects: first, even small amounts of capital can cause significant short-term price fluctuations in gold, with intraday volatility being more pronounced than usual; second, the lack of participation from US institutional investors meant a lack of sustained incremental buying, making it difficult to push gold prices effectively above the key resistance level of $4200, and significantly weakening the bullish momentum.
Technical structure and key bullish/bearish price levels
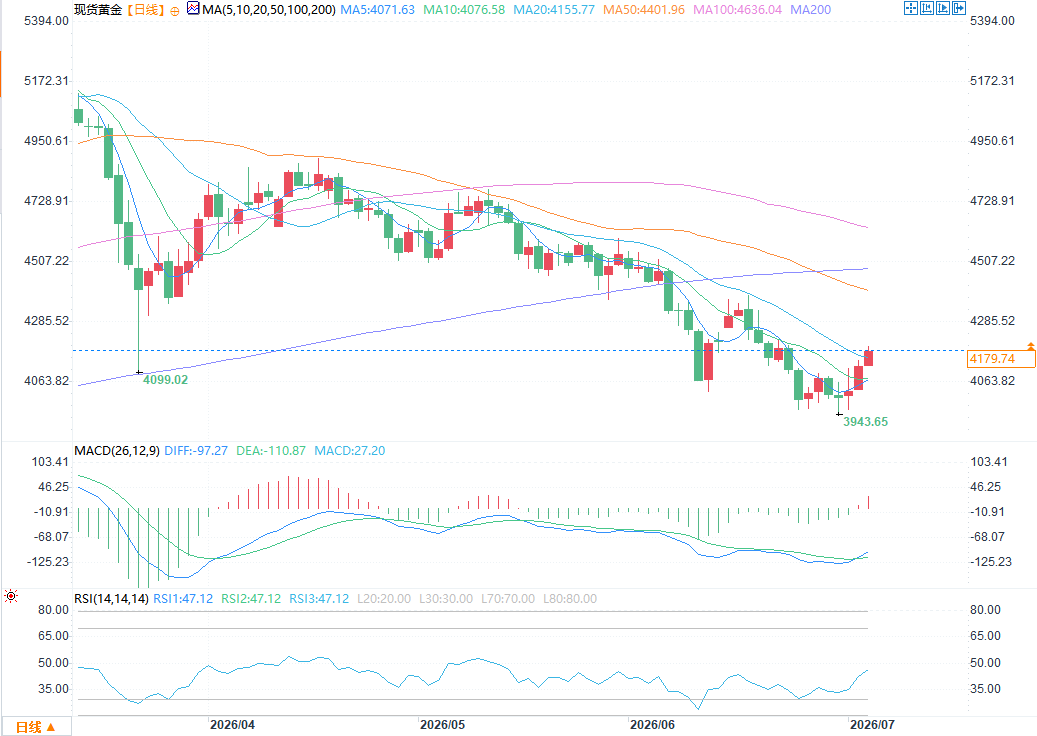
(Spot gold daily chart source: FX678)
From a short-term technical perspective, this rebound has reversed the previous weak and volatile pattern. Gold prices have continued to stand above all short-term moving averages, indicating a bullish technical structure. The short-term moving averages have formed a continuous support zone, and as long as gold prices do not effectively break below this range, the short-term rebound trend will not be broken.
The key resistance and support levels across all phases are clearly defined, serving as a core reference for short-term trading.
Resistance levels: First resistance is $4200 (a key psychological level that has been repeatedly tested and failed to break through, serving as a short-term dividing line between bulls and bears); second resistance is $4250; third strong resistance is $4300. Only if gold prices continue to hold above $4200 can it be confirmed that the bulls have completely taken control of the short-term market, opening up upward space to challenge $4250 and even $4300.
Support levels: The first key support is $4120, which is the core pivot point for the current rebound. A decisive break below this level would indicate that the rebound is merely a short-term technical correction, not a trend reversal. The second support is $4100; the third strong support is $4050. If the price falls below $4120, the bears will regain control of the market, and the price will likely test the $4100 and $4050 support zone.
From a comprehensive technical perspective, the current market sentiment is cautiously optimistic in the short term, with the bulls holding a slight advantage. However, the 4200 level presents significant resistance, and without new major positive data, it will be difficult to break through it in one go.
Looking back at the complete logic behind this round of gold price increases, the core driver came from the significant weakening of the US labor market, the market's downward revision of the Fed's interest rate hike expectations this year, and the simultaneous weakening of the dollar, which provided valuation support for non-yielding gold. However, multiple factors, such as geopolitical risk aversion diverting dollar buying, liquidity contraction due to the US Independence Day holiday, and inflation data remaining high, have continued to suppress the upside potential of gold prices. In the short term, there is a significant divergence between bulls and bears, and the future trend will still require guidance from multiple key data and Fed speeches.
US jobs data fell far short of expectations, significantly dampening expectations for a Federal Reserve rate hike.
The core trigger for this substantial rebound in gold prices was the unexpectedly weak US non-farm payrolls data for June, released on Thursday evening. This employment report fully signaled a weakening labor market, completely reversing the market's previous hawkish pricing in interest rate hikes.
The market had previously expected the U.S. to add 110,000 non-farm payroll jobs in June, but the actual figure was only 57,000, just half of the expected value and significantly lower than market expectations. Not only did the monthly job growth figure fall sharply, but the Bureau of Labor Statistics also revised down the employment data for the previous two months, with a cumulative reduction of 74,000 jobs in April and May. Among them, the number of jobs in May was revised from the initial value of 172,000 to 129,000. The downward revision of employment data for two consecutive months proves that the U.S. job market continues to cool down and the momentum of economic expansion continues to slow down.
A common misconception in the market is that while the unemployment rate has slightly fallen to 4.2%, seemingly indicating positive employment data, this does not necessarily reflect a strengthening economy. The core reason for the decline in the unemployment rate is a lower labor force participation rate, meaning fewer people are actively seeking work, leading to a contraction in the labor supply and thus suppressing the unemployment rate. This is a typical signal of weak employment and does not demonstrate the resilience of the US economy. Coupled with weakening US wage data and slower growth in household income, market concerns about persistently high inflation have also eased.
Following the release of the employment data, market expectations shifted dramatically. Before the data release, the market was betting on a 66% probability of a 25 basis point rate hike by the Federal Reserve in September; after the non-farm payroll data was released, this probability dropped to 54%. Previously, the mainstream market view was that the Fed would start raising rates as early as September, but most trading institutions have now revised their judgments, believing that the Fed will postpone its rate hike until December, with some trading models even predicting that the Fed's rate hikes throughout 2026 will be only 0 to 1 percentage point.
Gold is a non-interest-bearing asset. When market expectations for interest rate hikes rise and US Treasury yields increase, the opportunity cost of holding gold increases significantly, and funds tend to flow out of gold and into interest-bearing assets such as the US dollar and US Treasury bonds. Conversely, when expectations for interest rate hikes cool and US Treasury yields decline, the opportunity cost of holding gold decreases, and funds flow back into the precious metals market. Coupled with the continued weakening of the US dollar index due to expectations of interest rate cuts, falling to a two-week low, gold, priced in US dollars, naturally gained direct upward momentum. After the data release, gold prices surged by more than 2% in a single day, reaching a high of $4179, a new high since June 23. August gold futures followed suit, showing a clear rebound.
In addition, the continued gold purchases by central banks worldwide provide a stable long-term demand for gold. Even if short-term market fluctuations occur, the continued increase in gold reserves by central banks can offset temporary selling pressure, building a long-term bottom support for gold prices and preventing a deep correction. This is also a crucial underlying support that has enabled the current rebound to last for three days. Meanwhile, the continued decline in international crude oil prices further weakens the risk of rising inflation, indirectly reducing the necessity for the Federal Reserve to tighten monetary policy, creating a confluence of multiple positive factors.
Multiple negative factors limit upside potential, making a one-sided surge in gold prices unlikely.
Despite the strong positive catalyst from the employment data, the market did not break out of its one-sided bullish trend, with the $4,200 level continuing to act as strong resistance, mainly due to three negative factors.
First, ongoing geopolitical conflicts are diverting safe-haven funds, supporting a stronger dollar and limiting gold's gains. Recent tensions between the US and Iran have escalated, with media reports indicating US officials are concerned about Israel's plans to assassinate senior Iranian negotiators during indirect US-Iran peace talks. The US believes such actions would directly destroy peace negotiations and ignite a new round of conflict in the Middle East. Meanwhile, the Iranian military has publicly stated a strong stance, indicating that if the US interferes with shipping in the Strait of Hormuz, Iran will retaliate swiftly and decisively. Middle East geopolitical risks possess strong safe-haven characteristics, and the US dollar is a traditional core safe-haven asset. Once market panic intensifies, funds will prioritize flowing into the dollar, pushing up the dollar index and consequently suppressing gold's upward potential, creating a unique hedging scenario where gold and the dollar rise in tandem, thus limiting the magnitude of gold price increases.
Second, US inflation remains high, and the Federal Reserve's core policy objectives have not yet been achieved, making a complete shift to easing unlikely. It's important to clarify that a single weak employment report is insufficient to fundamentally change the Fed's overall monetary policy stance. Currently, overall US inflation remains above 4%, and controlling inflation remains the Fed's top priority. Even with weakening employment, as long as inflation doesn't decline significantly, the Fed will not easily abandon its rate hike plan. The market should not overly bet on continued dovish expectations, as profit-taking by bullish investors is suppressing gold prices. If subsequent inflation data shows further increases, market expectations for rate hikes will rebound rapidly, immediately putting downward pressure on gold prices.
Third, the US Independence Day holiday led to a significant contraction in market liquidity, amplifying price volatility while suppressing trend-following movements. On Friday, the US market was closed for Independence Day, with trading in US stocks and bonds suspended, resulting in global gold market trading volume far below normal levels. Insufficient liquidity has two main effects: first, even small amounts of capital can cause significant short-term price fluctuations in gold, with intraday volatility being more pronounced than usual; second, the lack of participation from US institutional investors meant a lack of sustained incremental buying, making it difficult to push gold prices effectively above the key resistance level of $4200, and significantly weakening the bullish momentum.
Technical structure and key bullish/bearish price levels
(Spot gold daily chart source: FX678)
From a short-term technical perspective, this rebound has reversed the previous weak and volatile pattern. Gold prices have continued to stand above all short-term moving averages, indicating a bullish technical structure. The short-term moving averages have formed a continuous support zone, and as long as gold prices do not effectively break below this range, the short-term rebound trend will not be broken.
The key resistance and support levels across all phases are clearly defined, serving as a core reference for short-term trading.
Resistance levels: First resistance is $4200 (a key psychological level that has been repeatedly tested and failed to break through, serving as a short-term dividing line between bulls and bears); second resistance is $4250; third strong resistance is $4300. Only if gold prices continue to hold above $4200 can it be confirmed that the bulls have completely taken control of the short-term market, opening up upward space to challenge $4250 and even $4300.
Support levels: The first key support is $4120, which is the core pivot point for the current rebound. A decisive break below this level would indicate that the rebound is merely a short-term technical correction, not a trend reversal. The second support is $4100; the third strong support is $4050. If the price falls below $4120, the bears will regain control of the market, and the price will likely test the $4100 and $4050 support zone.
From a comprehensive technical perspective, the current market sentiment is cautiously optimistic in the short term, with the bulls holding a slight advantage. However, the 4200 level presents significant resistance, and without new major positive data, it will be difficult to break through it in one go.
- Risk Warning and Disclaimer
- The market involves risk, and trading may not be suitable for all investors. This article is for reference only and does not constitute personal investment advice, nor does it take into account certain users’ specific investment objectives, financial situation, or other needs. Any investment decisions made based on this information are at your own risk.