US Treasury bonds rebound, but no one dares to buy? Two major storms are approaching this week.
2026-07-06 20:28:31
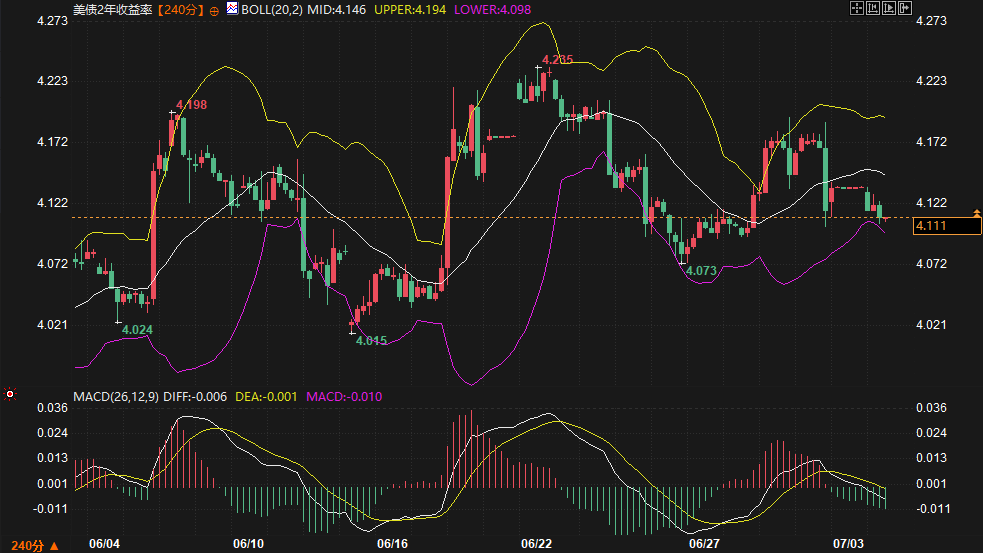
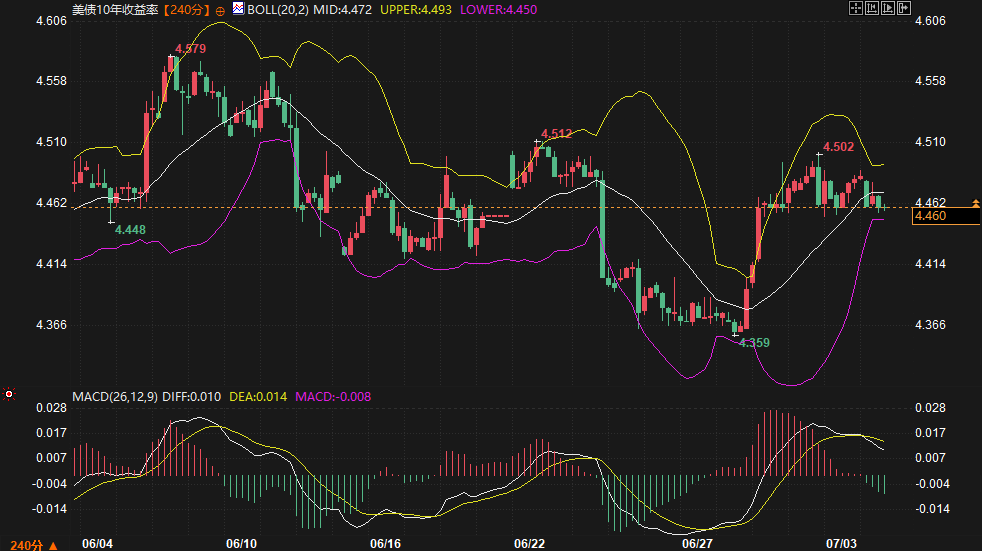
On Monday (July 6th), the US Treasury market reopened after the long holiday. Short-term yields saw moderate buying due to falling oil prices and easing inflation concerns, while long-term yields were pressured by soaring Japanese government bond yields and a $119 billion quarterly supply this week. Technically, both the 2-year and 10-year yields have formed a death cross, with the 10-year yield closely following the lower Bollinger Band. Market sentiment leans towards selling on rallies, with focus shifting to ISM services data and Wednesday's FOMC minutes, awaiting a catalyst to break the weak equilibrium.

Summary : Fundamentals: Oil prices declined due to the normalization of cross-strait shipping. Major overseas institutions even discussed the possibility of Brent crude reaching $60 if the situation further eases. This, coupled with Fed Chairman Warsh's earlier indication of easing inflation risks, weakened expectations of a short-term rate hike, benefiting short-term bonds. However, long-term prices were siphoned off by funds drawn in by the rise in the Japanese 10-year yield to 2.835%, and by supply shocks. Sentiment: Cash that exited the market due to inflation fears is flowing back into short-term assets, indicating insufficient confidence in long-term assets. Technical Analysis: The 240-minute chart shows that the 10-year MACD has just formed a death cross above the zero line, and the price has fallen to near the lower Bollinger Band; the 2-year MACD death cross continues below the zero line, both indicating a bearish convergence. This week's FOMC minutes are particularly significant due to the lack of public guidance from the chairman and could be a catalyst for a market reversal.
The continued normalization of shipping in the Strait of Hormuz and the easing of oil risk premiums have effectively alleviated short-term inflation fears and reduced upward pressure on the interest rate-sensitive 2-year yield. Meanwhile, the yield on Japanese 10-year government bonds climbed to its highest level since 1997, while the yen remained at multi-decade lows, weakening Japanese investors' interest in long-term US Treasuries. Coupled with quarterly refinancing supply exceeding hundreds of billions of dollars, long-term bonds are facing real selling pressure, clearly revealing a gap between short-term strength and long-term weakness in fundamentals.
The 10-year yield peaked at 4.579% and has since fallen below the 4.472% middle band, now trading close to the 4.450% lower band. The MACD has formed a death cross above the zero line, and the green bars are beginning to appear. If the 4.450% level is confirmed to be breached, the next important support level is the previous low of 4.359%. The 2-year yield is maintaining a weak oscillation between the middle band at 4.146% and the lower band at 4.098%, with the MACD death cross below the zero line showing no signs of abating. Neither yield shows a bottom divergence, indicating that bearish momentum dominates, and the bulls can only defend their position using the psychological support of the lower band.
Scenario 1: Weak downward movement, testing support (55% probability) . The 10-year yen continues its decline below the 4.472%-4.493% resistance level, breaking below the lower trendline and seeking support at 4.44% and 4.359%. This is based on the unresolved supply pressures and the weakness of the yen in the short term, the initial bearish crossover on the technical charts, and the expected mild decline in Monday's ISM services data, leaving the bulls lacking a clear direction for a counterattack.
Scenario 2: Holding above the lower Bollinger Band, consolidating within a range (30% probability) . The 10-year futures contract is fluctuating within the 4.450%-4.480% range, awaiting Wednesday's minutes. This is based on the Bollinger Bands not expanding, increased short-covering demand after consecutive bearish candles, and short-term capital inflows providing a buffer for market sentiment.
Scenario 3: Unexpected strengthening, rebound and recovery (15% probability) . If the ISM data significantly exceeds expectations, or a sudden geopolitical event pushes up oil prices, concerns about interest rate hikes may reignite, driving the 10-year moving average to test the middle band at 4.472% and the upper band at 4.493%. Although the probability is low, it is a tail risk that must be guarded against.
Current trading favors selling on rallies. Caution is advised: if Wednesday's FOMC minutes reveal significant disagreements among committee members regarding the inflation path, it could amplify volatility; a NATO summit statement concerning the Russia-Ukraine situation could trigger safe-haven buying, clashing with supply-side headwinds. Furthermore, any policy hints from the Bank of Japan could exacerbate selling pressure on long-term rates. While funds are flowing back into short-term rates, the significant issuance of treasury bills should be monitored for its draining effect on overnight interest rates.
Outlook: In the short term, long-term yields still have downward momentum. Attention should be paid to whether the 4.450% area can provide an effective buffer; if it breaks, the next target is 4.44%. The 2-year yield, supported by short-term funding preferences, may consolidate around 4.10%. Unless there are unexpectedly hawkish data releases, the downside potential for long-term yields is greater than for short-term yields, and the flattening trading logic will continue. In the medium term, whether the June minutes confirm a consensus on cooling inflation will determine whether yields fall further or experience a retaliatory rebound above 4.50%. The market will remain highly sensitive ahead of a series of risk events.
Why are short-term yields holding firm while long-term yields are weakening?
The drop in oil prices directly compressed short-term inflation expectations, weakening the urgency of interest rate hikes, and directly benefiting the 2-year bond market, which is highly sensitive to policy. Longer-term bonds, on the other hand, face competition for funds from Japanese government bond yields soaring to near 30-year highs, as well as selling pressure from the large-scale refinancing supply this week.
What does a 10-year death cross mean?
The 240-minute MACD has just formed a death cross above the zero line with expanding green bars, indicating that short-term bearish momentum is dominant. The price is currently close to the lower Bollinger Band at 4.450%. If this level is broken, the downward trend may accelerate, seeking support at the previous low of 4.359%.
What event is most likely to break the deadlock this week?
The minutes of the June FOMC meeting, released on Wednesday, will provide the most direct clues for the market to recalibrate expectations, given the limited public guidance provided by new Chairman Warsh and the detailed discussions among committee members on inflation, employment, and the path of interest rates.
How are geopolitical situations affecting the current bond market?
NATO's supportive stance on the Russia-Ukraine situation at the summit could trigger risk aversion, theoretically benefiting US Treasuries. However, heavy supply pressure at the long end partially offset this effect, causing safe-haven buying to concentrate more on the short end, exacerbating yield curve divergence.
What is the overall trading sentiment like right now?
Sentiment is cautious, with a tendency to tentatively sell at resistance levels. Funds that exited the market earlier due to inflation panic are now being reallocated to short-term bonds and the overnight market, while long-term funds are remaining restrained and awaiting clear signals before data and supply become clearer.
Summary : Fundamentals: Oil prices declined due to the normalization of cross-strait shipping. Major overseas institutions even discussed the possibility of Brent crude reaching $60 if the situation further eases. This, coupled with Fed Chairman Warsh's earlier indication of easing inflation risks, weakened expectations of a short-term rate hike, benefiting short-term bonds. However, long-term prices were siphoned off by funds drawn in by the rise in the Japanese 10-year yield to 2.835%, and by supply shocks. Sentiment: Cash that exited the market due to inflation fears is flowing back into short-term assets, indicating insufficient confidence in long-term assets. Technical Analysis: The 240-minute chart shows that the 10-year MACD has just formed a death cross above the zero line, and the price has fallen to near the lower Bollinger Band; the 2-year MACD death cross continues below the zero line, both indicating a bearish convergence. This week's FOMC minutes are particularly significant due to the lack of public guidance from the chairman and could be a catalyst for a market reversal.
Fundamental Gap: Short End Benefits from Oil Price Dividends, Long Ends Face Double Squeeze
The continued normalization of shipping in the Strait of Hormuz and the easing of oil risk premiums have effectively alleviated short-term inflation fears and reduced upward pressure on the interest rate-sensitive 2-year yield. Meanwhile, the yield on Japanese 10-year government bonds climbed to its highest level since 1997, while the yen remained at multi-decade lows, weakening Japanese investors' interest in long-term US Treasuries. Coupled with quarterly refinancing supply exceeding hundreds of billions of dollars, long-term bonds are facing real selling pressure, clearly revealing a gap between short-term strength and long-term weakness in fundamentals.
Technical Resonance: The Battle Between Death Cross Resistance and Key Support
The 10-year yield peaked at 4.579% and has since fallen below the 4.472% middle band, now trading close to the 4.450% lower band. The MACD has formed a death cross above the zero line, and the green bars are beginning to appear. If the 4.450% level is confirmed to be breached, the next important support level is the previous low of 4.359%. The 2-year yield is maintaining a weak oscillation between the middle band at 4.146% and the lower band at 4.098%, with the MACD death cross below the zero line showing no signs of abating. Neither yield shows a bottom divergence, indicating that bearish momentum dominates, and the bulls can only defend their position using the psychological support of the lower band.
Scenario Simulation: Probabilities and Basis of Three Paths
Scenario 1: Weak downward movement, testing support (55% probability) . The 10-year yen continues its decline below the 4.472%-4.493% resistance level, breaking below the lower trendline and seeking support at 4.44% and 4.359%. This is based on the unresolved supply pressures and the weakness of the yen in the short term, the initial bearish crossover on the technical charts, and the expected mild decline in Monday's ISM services data, leaving the bulls lacking a clear direction for a counterattack.
Scenario 2: Holding above the lower Bollinger Band, consolidating within a range (30% probability) . The 10-year futures contract is fluctuating within the 4.450%-4.480% range, awaiting Wednesday's minutes. This is based on the Bollinger Bands not expanding, increased short-covering demand after consecutive bearish candles, and short-term capital inflows providing a buffer for market sentiment.
Scenario 3: Unexpected strengthening, rebound and recovery (15% probability) . If the ISM data significantly exceeds expectations, or a sudden geopolitical event pushes up oil prices, concerns about interest rate hikes may reignite, driving the 10-year moving average to test the middle band at 4.472% and the upper band at 4.493%. Although the probability is low, it is a tail risk that must be guarded against.
Sentiment and Risk: Minutes, Geopolitics, and Capital Rebalancing
Current trading favors selling on rallies. Caution is advised: if Wednesday's FOMC minutes reveal significant disagreements among committee members regarding the inflation path, it could amplify volatility; a NATO summit statement concerning the Russia-Ukraine situation could trigger safe-haven buying, clashing with supply-side headwinds. Furthermore, any policy hints from the Bank of Japan could exacerbate selling pressure on long-term rates. While funds are flowing back into short-term rates, the significant issuance of treasury bills should be monitored for its draining effect on overnight interest rates.
Outlook: In the short term, long-term yields still have downward momentum. Attention should be paid to whether the 4.450% area can provide an effective buffer; if it breaks, the next target is 4.44%. The 2-year yield, supported by short-term funding preferences, may consolidate around 4.10%. Unless there are unexpectedly hawkish data releases, the downside potential for long-term yields is greater than for short-term yields, and the flattening trading logic will continue. In the medium term, whether the June minutes confirm a consensus on cooling inflation will determine whether yields fall further or experience a retaliatory rebound above 4.50%. The market will remain highly sensitive ahead of a series of risk events.
Frequently Asked Questions
Why are short-term yields holding firm while long-term yields are weakening?
The drop in oil prices directly compressed short-term inflation expectations, weakening the urgency of interest rate hikes, and directly benefiting the 2-year bond market, which is highly sensitive to policy. Longer-term bonds, on the other hand, face competition for funds from Japanese government bond yields soaring to near 30-year highs, as well as selling pressure from the large-scale refinancing supply this week.
What does a 10-year death cross mean?
The 240-minute MACD has just formed a death cross above the zero line with expanding green bars, indicating that short-term bearish momentum is dominant. The price is currently close to the lower Bollinger Band at 4.450%. If this level is broken, the downward trend may accelerate, seeking support at the previous low of 4.359%.
What event is most likely to break the deadlock this week?
The minutes of the June FOMC meeting, released on Wednesday, will provide the most direct clues for the market to recalibrate expectations, given the limited public guidance provided by new Chairman Warsh and the detailed discussions among committee members on inflation, employment, and the path of interest rates.
How are geopolitical situations affecting the current bond market?
NATO's supportive stance on the Russia-Ukraine situation at the summit could trigger risk aversion, theoretically benefiting US Treasuries. However, heavy supply pressure at the long end partially offset this effect, causing safe-haven buying to concentrate more on the short end, exacerbating yield curve divergence.
What is the overall trading sentiment like right now?
Sentiment is cautious, with a tendency to tentatively sell at resistance levels. Funds that exited the market earlier due to inflation panic are now being reallocated to short-term bonds and the overnight market, while long-term funds are remaining restrained and awaiting clear signals before data and supply become clearer.
- Risk Warning and Disclaimer
- The market involves risk, and trading may not be suitable for all investors. This article is for reference only and does not constitute personal investment advice, nor does it take into account certain users’ specific investment objectives, financial situation, or other needs. Any investment decisions made based on this information are at your own risk.