Why is Brent crude not falling despite increased supply and low inventory?
2026-07-07 14:58:17
The current crude oil market is not simply trading on "Iran news," but rather repricing three things: whether the risk in the Strait of Hormuz has eased, whether the increase in oil production by oil-producing countries has actually materialized, and whether low inventories can continue to buffer supply disruptions. On Tuesday, July 7, Brent crude oil was quoted at approximately $72.80 per barrel, a daily increase of about 1%.

The latest disturbance comes from a statement by Iranian Foreign Minister Araqchi. He stated that Article 13 of the Memorandum of Understanding clearly states that if the threats persist, negotiations for a final agreement will not begin, and demanded that the other side abide by the signed agreement. The market implications of this statement lie not in the diplomatic wording itself, but in the fact that it pulls the negotiation process back into a "conditional exchange" framework, meaning that the rapid easing path previously bet on by the oil market is not secure.
The key is not to judge whether the negotiations will definitely break down or succeed, but to identify the residual forms of risk premium. The fact that Brent crude has not experienced a smooth decline after falling from its highs over the past two weeks indicates that short sellers have not completely eliminated the Hormuz risk from their pricing. As long as uncertainties remain regarding shipping routes, insurance costs, the recovery of shipping schedules, and the pace of negotiations, oil prices are unlikely to decline linearly simply according to the logic of ample supply and demand.
The negative factors on the supply side are relatively clear. Information shows that some members of the OPEC+ alliance plan to increase supply by 188,000 barrels per day starting in August, a signal of supply recovery that the market has faced for several months. On July 6, the Brent September contract fell to around $71.65 per barrel, and the WTI August contract fell to around $68.28 per barrel, reflecting that the market had already priced in the production increase news.
However, increased production does not equate to an immediate flood of deliverable supply into the market. Crude oil pricing also depends on shipping, freight rates, refinery purchasing pace, and the spot discount structure. If shipping around the Hormuz gradually resumes, the supply recovery will increase pressure on distant markets; if channel risks persist, the downward pressure on near-term prices from increased production commitments will be offset by logistical risks. In other words, current oil prices face a mixed pricing pattern of "relaxed supply expectations and unresolved transportation risks," rather than a one-sidedly loose market.
The latest weekly report from the U.S. Department of Energy shows that for the week ending June 26, U.S. commercial crude oil inventories decreased by 3.8 million barrels to 408.4 million barrels, approximately 7% below the five-year average for the same period; refinery utilization rose to 96.6%, with crude oil processing averaging 17.2 million barrels per day. Gasoline inventories decreased by 2.3 million barrels, while distillate fuel inventories increased by 2.5 million barrels. The four-week average for refined product supplies was 20.6 million barrels per day, up 1.7% year-on-year.
This data suggests that the market is not without demand support. Higher refinery operating rates will increase crude oil consumption, but weaker-than-expected gasoline demand will limit further expansion of refined product crack spreads. The significance of low inventory levels lies in reducing the smoothness of downward price repricing. In other words, even if supply-side pressure eases, unless commercial inventories are significantly replenished, the price decline is more likely to be volatile rather than a one-sided trend.
From the daily chart, Brent crude oil futures have fallen from around $98.95 to around $73, with a low of $70.13. The Bollinger Bands have a middle band of approximately $81.61, an upper band of approximately $100.10, and a lower band of approximately $63.11. The price is trading close to the lower band, indicating that the previous downtrend has not been fully reversed, but the short-term downward momentum has shown signs of weakening.
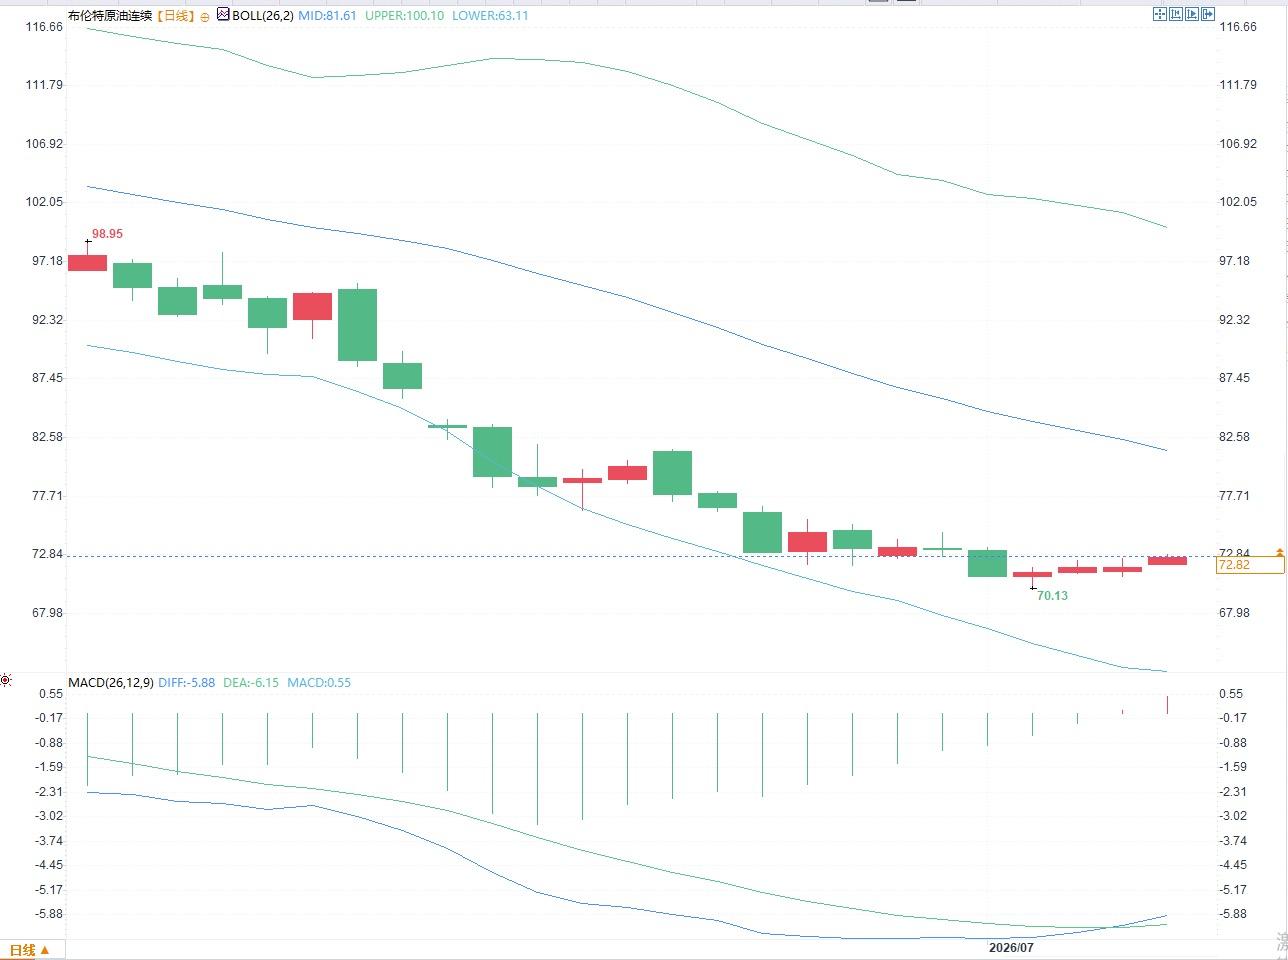
Regarding the MACD, the DIFF is around -5.88, the DEA is around -6.15, and the histogram has turned to +0.55, indicating a weak correction rather than a trend reversal. Two phenomena should be emphasized when interpreting the chart: First, the price is consolidating sideways above $70, suggesting some trading activity in this area; second, the Bollinger Middle Band is still clearly exerting downward pressure, indicating that the medium-term moving average resistance has not yet been relieved. Therefore, the current technical chart pattern resembles a "low-level consolidation after a sharp drop" rather than a completed directional shift.
Key news: Oil prices have not fully exited the risk premium.
The latest disturbance comes from a statement by Iranian Foreign Minister Araqchi. He stated that Article 13 of the Memorandum of Understanding clearly states that if the threats persist, negotiations for a final agreement will not begin, and demanded that the other side abide by the signed agreement. The market implications of this statement lie not in the diplomatic wording itself, but in the fact that it pulls the negotiation process back into a "conditional exchange" framework, meaning that the rapid easing path previously bet on by the oil market is not secure.
The key is not to judge whether the negotiations will definitely break down or succeed, but to identify the residual forms of risk premium. The fact that Brent crude has not experienced a smooth decline after falling from its highs over the past two weeks indicates that short sellers have not completely eliminated the Hormuz risk from their pricing. As long as uncertainties remain regarding shipping routes, insurance costs, the recovery of shipping schedules, and the pace of negotiations, oil prices are unlikely to decline linearly simply according to the logic of ample supply and demand.
Supply side: Increased production is a pressure, but not a variable that will immediately crush prices.
The negative factors on the supply side are relatively clear. Information shows that some members of the OPEC+ alliance plan to increase supply by 188,000 barrels per day starting in August, a signal of supply recovery that the market has faced for several months. On July 6, the Brent September contract fell to around $71.65 per barrel, and the WTI August contract fell to around $68.28 per barrel, reflecting that the market had already priced in the production increase news.
However, increased production does not equate to an immediate flood of deliverable supply into the market. Crude oil pricing also depends on shipping, freight rates, refinery purchasing pace, and the spot discount structure. If shipping around the Hormuz gradually resumes, the supply recovery will increase pressure on distant markets; if channel risks persist, the downward pressure on near-term prices from increased production commitments will be offset by logistical risks. In other words, current oil prices face a mixed pricing pattern of "relaxed supply expectations and unresolved transportation risks," rather than a one-sidedly loose market.
Inventory and Demand: Low inventory levels provide a buffer for prices.
The latest weekly report from the U.S. Department of Energy shows that for the week ending June 26, U.S. commercial crude oil inventories decreased by 3.8 million barrels to 408.4 million barrels, approximately 7% below the five-year average for the same period; refinery utilization rose to 96.6%, with crude oil processing averaging 17.2 million barrels per day. Gasoline inventories decreased by 2.3 million barrels, while distillate fuel inventories increased by 2.5 million barrels. The four-week average for refined product supplies was 20.6 million barrels per day, up 1.7% year-on-year.
This data suggests that the market is not without demand support. Higher refinery operating rates will increase crude oil consumption, but weaker-than-expected gasoline demand will limit further expansion of refined product crack spreads. The significance of low inventory levels lies in reducing the smoothness of downward price repricing. In other words, even if supply-side pressure eases, unless commercial inventories are significantly replenished, the price decline is more likely to be volatile rather than a one-sided trend.
Technical Structure: Brent crude is in a consolidation zone after a decline.
From the daily chart, Brent crude oil futures have fallen from around $98.95 to around $73, with a low of $70.13. The Bollinger Bands have a middle band of approximately $81.61, an upper band of approximately $100.10, and a lower band of approximately $63.11. The price is trading close to the lower band, indicating that the previous downtrend has not been fully reversed, but the short-term downward momentum has shown signs of weakening.
Regarding the MACD, the DIFF is around -5.88, the DEA is around -6.15, and the histogram has turned to +0.55, indicating a weak correction rather than a trend reversal. Two phenomena should be emphasized when interpreting the chart: First, the price is consolidating sideways above $70, suggesting some trading activity in this area; second, the Bollinger Middle Band is still clearly exerting downward pressure, indicating that the medium-term moving average resistance has not yet been relieved. Therefore, the current technical chart pattern resembles a "low-level consolidation after a sharp drop" rather than a completed directional shift.
- Risk Warning and Disclaimer
- The market involves risk, and trading may not be suitable for all investors. This article is for reference only and does not constitute personal investment advice, nor does it take into account certain users’ specific investment objectives, financial situation, or other needs. Any investment decisions made based on this information are at your own risk.