Renewed tensions between the US and Iran are putting pressure on gold prices, with spot gold hovering around the $4,100 mark.
2026-07-08 08:20:28
On Wednesday (July 8) in early Asian trading, spot gold came under pressure and traded around $4,100 per ounce.
Precious metals are facing renewed selling pressure due to renewed geopolitical tensions.
Investors are closely watching the release of the Federal Reserve's June meeting minutes later on Wednesday for further policy clues.

According to a statement released by U.S. Central Command on Tuesday, the U.S. military has begun a series of powerful strikes against Iran to “inflict heavy costs on Iranian attacks against civilian vessels operating in international waters.”
Previously, three commercial oil tankers transiting the Strait of Hormuz were attacked by Iran, and the United States responded militarily.
This development has further strained relations between the US and Iran—just last month the two countries signed a provisional peace agreement, ending conflict on all fronts and reopening the Strait of Hormuz.
The renewed conflict could exacerbate concerns about energy price-driven inflation, thus putting downward pressure on non-interest-bearing gold.
The U.S. nonfarm payrolls report released last week was weak, with only 57,000 new jobs added, far below the revised 129,000 in May and also below the market expectation of 110,000.
This data prompted traders to reduce their bets on a Fed rate hike, thus providing some support for gold prices and limiting further downside.
In its "Mid-Term Outlook 2026" released in early July, the World Gold Council (WGC) noted that spot gold experienced significant volatility in the first half of the year (reaching a record high of over $5,500 in January before falling back to around $4,000, a drop of approximately 30%), but remained one of the best-performing assets over the past 12 months. Under the current macroeconomic consensus (global growth of approximately 2.9%, cooling but still relatively high inflation, and a potential Fed rate hike in October), gold is expected to consolidate within a range of $4,100/ounce ± 5% in the second half of the year, reflecting an environment of moderate growth, limited tightening, and geopolitical balance.
The WGC emphasizes that current prices already reflect macroeconomic dynamics well, but there is potential for a breakout. Upside catalysts include economic or geopolitical deterioration (especially conflicts related to Iran), a reversal in interest rate expectations (towards easing), or large-scale bargain hunting by long-term investors, which could push gold prices back above $4,500, and even potentially approach $5,000 under strong signals. Central bank purchases and physical demand will provide floor support, and a drop of more than 10% typically attracts long-term buying from multiple regions.
Goldman Sachs stated that in the short term, gold faces pressure from a stronger dollar, rising yields, and a recovery in investor risk appetite, and may continue to consolidate around current levels or experience a slight pullback. However, the medium- to long-term bullish logic remains unchanged: the Federal Reserve's eventual shift to easing (expected in 2027), continued geopolitical uncertainty, and gold's attractiveness as a non-dollar asset will drive ETF inflows and a recovery in physical demand.
Overall, the current gold market is a mixed bag: inflation concerns stemming from the escalating US-Iran conflict are weighing on gold prices, but weakening expectations of a Fed rate hike are providing support at the bottom.
Investors are awaiting the release of the minutes from the Federal Reserve's June meeting, which may provide new direction for gold prices.
Technically, according to the daily chart, spot gold has entered a medium-to-long-term downward channel since its recent high of 4773.37. The price has been weakening and fluctuating, bottoming out at 3943.65 before rebounding. Currently, the price is trading around 4100. The moving average system clearly shows a bearish trend. The short-term 20-day moving average (MA20) (4140.98), the medium-term 50-day moving average (MA50), and the 100-day moving average (MA100) are all downward pressure on the price, which is below the 20-day moving average. Only the long-term 200-day moving average (MA200) is far above, indicating that the medium-term downward trend has not reversed.
In terms of indicators, the MACD is below the zero axis, the DIFF line crosses the DEA line to form a golden cross, the red histogram continues to increase in volume, the downward momentum has significantly weakened, and the short-term recovery and rebound momentum is sufficient.
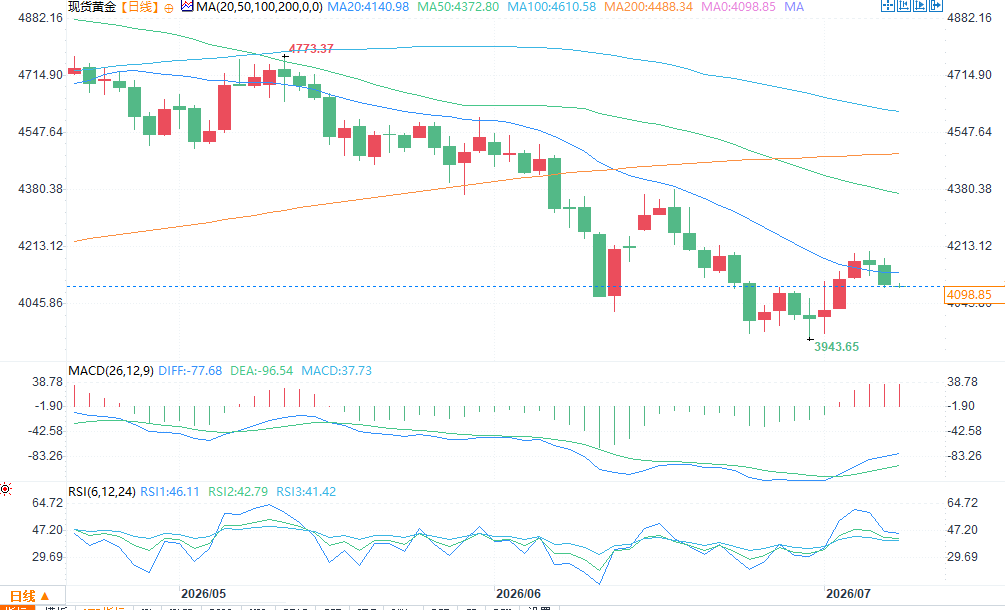
(Spot gold daily chart, source: FX678)
At 7:49 AM Beijing time on July 8, spot gold was trading at $4,098.12 per ounce.
Precious metals are facing renewed selling pressure due to renewed geopolitical tensions.
Investors are closely watching the release of the Federal Reserve's June meeting minutes later on Wednesday for further policy clues.
Geopolitics: Escalating US-Iran conflict and concerns about energy inflation weigh on gold prices.
According to a statement released by U.S. Central Command on Tuesday, the U.S. military has begun a series of powerful strikes against Iran to “inflict heavy costs on Iranian attacks against civilian vessels operating in international waters.”
Previously, three commercial oil tankers transiting the Strait of Hormuz were attacked by Iran, and the United States responded militarily.
This development has further strained relations between the US and Iran—just last month the two countries signed a provisional peace agreement, ending conflict on all fronts and reopening the Strait of Hormuz.
The renewed conflict could exacerbate concerns about energy price-driven inflation, thus putting downward pressure on non-interest-bearing gold.
Monetary Policy: Weak non-farm payroll data and easing expectations of interest rate hikes provide support.
The U.S. nonfarm payrolls report released last week was weak, with only 57,000 new jobs added, far below the revised 129,000 in May and also below the market expectation of 110,000.
This data prompted traders to reduce their bets on a Fed rate hike, thus providing some support for gold prices and limiting further downside.
Institutional Views
In its "Mid-Term Outlook 2026" released in early July, the World Gold Council (WGC) noted that spot gold experienced significant volatility in the first half of the year (reaching a record high of over $5,500 in January before falling back to around $4,000, a drop of approximately 30%), but remained one of the best-performing assets over the past 12 months. Under the current macroeconomic consensus (global growth of approximately 2.9%, cooling but still relatively high inflation, and a potential Fed rate hike in October), gold is expected to consolidate within a range of $4,100/ounce ± 5% in the second half of the year, reflecting an environment of moderate growth, limited tightening, and geopolitical balance.
The WGC emphasizes that current prices already reflect macroeconomic dynamics well, but there is potential for a breakout. Upside catalysts include economic or geopolitical deterioration (especially conflicts related to Iran), a reversal in interest rate expectations (towards easing), or large-scale bargain hunting by long-term investors, which could push gold prices back above $4,500, and even potentially approach $5,000 under strong signals. Central bank purchases and physical demand will provide floor support, and a drop of more than 10% typically attracts long-term buying from multiple regions.
Goldman Sachs stated that in the short term, gold faces pressure from a stronger dollar, rising yields, and a recovery in investor risk appetite, and may continue to consolidate around current levels or experience a slight pullback. However, the medium- to long-term bullish logic remains unchanged: the Federal Reserve's eventual shift to easing (expected in 2027), continued geopolitical uncertainty, and gold's attractiveness as a non-dollar asset will drive ETF inflows and a recovery in physical demand.
Market Outlook: Mixed Signals, Focus on the Fed Meeting Minutes
Overall, the current gold market is a mixed bag: inflation concerns stemming from the escalating US-Iran conflict are weighing on gold prices, but weakening expectations of a Fed rate hike are providing support at the bottom.
Investors are awaiting the release of the minutes from the Federal Reserve's June meeting, which may provide new direction for gold prices.
Technically, according to the daily chart, spot gold has entered a medium-to-long-term downward channel since its recent high of 4773.37. The price has been weakening and fluctuating, bottoming out at 3943.65 before rebounding. Currently, the price is trading around 4100. The moving average system clearly shows a bearish trend. The short-term 20-day moving average (MA20) (4140.98), the medium-term 50-day moving average (MA50), and the 100-day moving average (MA100) are all downward pressure on the price, which is below the 20-day moving average. Only the long-term 200-day moving average (MA200) is far above, indicating that the medium-term downward trend has not reversed.
In terms of indicators, the MACD is below the zero axis, the DIFF line crosses the DEA line to form a golden cross, the red histogram continues to increase in volume, the downward momentum has significantly weakened, and the short-term recovery and rebound momentum is sufficient.
(Spot gold daily chart, source: FX678)
At 7:49 AM Beijing time on July 8, spot gold was trading at $4,098.12 per ounce.
- Risk Warning and Disclaimer
- The market involves risk, and trading may not be suitable for all investors. This article is for reference only and does not constitute personal investment advice, nor does it take into account certain users’ specific investment objectives, financial situation, or other needs. Any investment decisions made based on this information are at your own risk.