With the Fed minutes about to be released, can gold's $4,100 defense level withstand a potentially devastating "higher and longer" attack?
2026-07-08 15:03:26
During Wednesday's (July 8) Asian trading session, spot gold saw a modest rebound, holding firmly above the $4,100 per ounce mark and briefly rising to around $4,130 per ounce. After two consecutive days of pullback, briefly dipping to this week's low, the current slight rise seems to offer a respite for the bulls. However, a closer look at the price action reveals that the upward momentum is rather limited; gold prices have not demonstrated strong breakout potential, and overall market sentiment remains cautious.
The direct reason for stabilizing gold prices lies in the failure of the US dollar index to maintain its previous slight rebound. Although dollar bulls attempted to push higher, investors were unwilling to make excessive bets before key risk events unfolded, choosing instead to wait and see. Market attention is now focused on the upcoming release of the minutes from the Federal Open Market Committee (FOMC) June meeting, a document that may provide clearer clues about the Fed's future policy path. Under the shadow of uncertainty, the upside potential of the dollar is limited, which objectively provides some support for dollar-denominated gold.
However, it's important to recognize that the current fundamental situation is far from confirming a trend reversal. Whether the previous pullback in gold prices has completely ended remains an open question. After all, just this Monday, gold prices briefly touched a two-week high—slightly above $4,200—before encountering selling pressure and falling back. The current slight rebound is more likely to be seen as a technical correction within a downtrend, rather than the start of a new upward trend. However, if gold prices can strongly recover the $4,200 level, a larger rebound is possible.

The recent surge in tensions in the Middle East has become a significant variable in the precious metals market. The US military launched a new round of strikes against targets in Iran on Tuesday, following reports of attacks on three oil tankers near the Strait of Hormuz. These events have seriously jeopardized the already fragile ceasefire agreement. Faced with the potential risk of escalation, traders are quickly pricing in geopolitical risk premiums across various asset classes.
Logically, geopolitical tensions usually benefit gold's safe-haven function, thus driving up its price. However, the situation is more complex this time—investors are also concerned that if the US-Iran confrontation escalates further, the dollar's status as the world's primary reserve currency may actually be strengthened, leading to capital flows into dollar assets seeking safety, which would then put downward pressure on gold. Therefore, geopolitical factors have a double-edged sword effect on gold prices, providing both support and potential risks.
Meanwhile, the US also took diplomatic action, revoking a key sanctions waiver that previously allowed Iran to sell crude oil on the international market. This move directly led to a sharp rise in crude oil prices of over 5% on Tuesday. The rise in energy prices reignited market concerns about a resurgence of inflationary pressures, and the rising inflation expectations further strengthened the market's judgment that the Federal Reserve will maintain a "higher and longer" interest rate stance. For gold, a high-interest-rate environment means an increased opportunity cost of holding non-interest-bearing assets, which is undoubtedly a significant factor suppressing gold prices in the medium to long term.
Judging from interest rate market pricing, traders' current expectations for the Federal Reserve's monetary policy are already quite hawkish. According to data monitored by the CME Group's FedWatch tool, the market currently believes there is an over 80% probability that the Fed will raise interest rates by at least 25 basis points before the end of this year. Such a high probability indicates that market participants generally believe that even if the US economy shows signs of cooling, the Fed will not easily back down in its determination to combat inflation.
The market also anticipates a hawkish tone in the upcoming FOMC meeting minutes. Investors generally believe the minutes may reveal concerns within policymakers about sticky inflation and caution regarding a potential backlash from premature policy easing. This expectation has directly driven US Treasury yields further upward, with the 10-year Treasury yield, a long-term benchmark, climbing to around 4.567%, and the 2-year Treasury yield, more sensitive to policy rate changes, rising to 4.189%.
Rising yields are undoubtedly good news for dollar bulls, as higher bond returns attract overseas funds to US assets, thus pushing up the dollar's exchange rate. A strong dollar, in turn, directly reduces the attractiveness of dollar-denominated gold. Furthermore, gold itself does not generate interest income; in an environment of persistently high interest rates, its relative investment value is naturally eroded. Therefore, from both interest rate and exchange rate perspectives, the current macroeconomic environment presents significant headwinds for gold.
From a daily chart perspective, gold prices are currently still trading within a clear downward channel and are generally below the 200-day Simple Moving Average (SMA), which is currently around $4488/oz. This suggests that the bearish tone of the medium-term trend has not fundamentally changed. However, some subtle changes have emerged in the technical indicators – the Moving Average Convergence Divergence (MACD) indicator has turned positive, which is generally considered a signal of improved short-term momentum, suggesting a potential rebound in gold prices.
However, we cannot conclude that the trend is about to reverse. The Relative Strength Index (RSI) is currently reading around 44, still below the 50-point threshold separating strength from weakness, indicating that the market's intrinsic upward momentum is insufficient and selling pressure still holds a relative advantage. In summary, any attempt at a rebound in the short term is likely to encounter heavy supply pressure near the upper channel line. Specifically, the first key resistance level is around $4164.35, which coincides with the upper edge of the short-term downtrend line.
If gold prices can convincingly break through this barrier, the next more significant test will be at the 200-day moving average, around $4488. Only a decisive break above this long-term moving average can alleviate the current broader bearish pressure from a technical perspective, thus laying the foundation for a trend reversal. On the downside, support is currently at the 9-day moving average around $4092, followed by the July 2nd low around $4030, and then the psychological level of $4000. A break below this level could open up further downside potential.
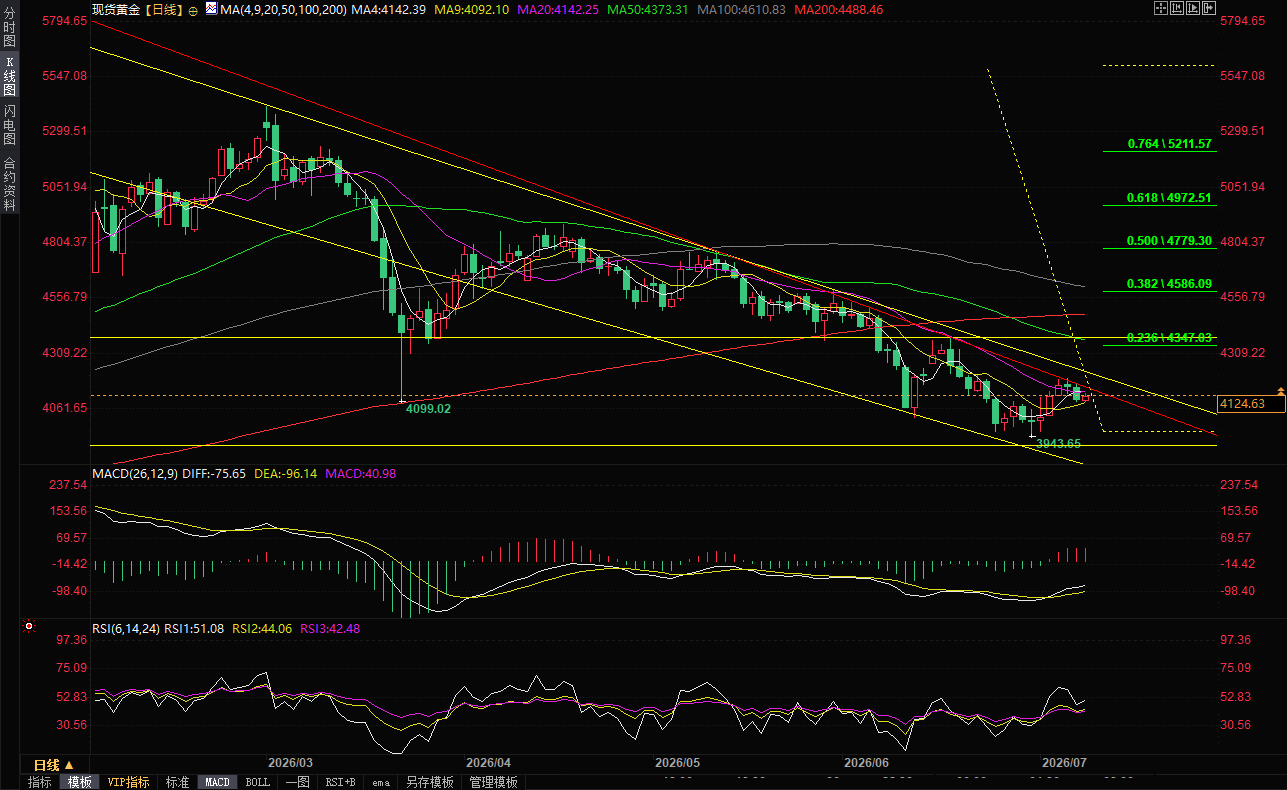
(Spot gold daily chart, source: FX678)
In summary, the current gold market is caught in a complex web of interplay between multiple factors. On one hand, the cautious stance of the US dollar ahead of key risk events and the uncertainty surrounding Middle East geopolitics provide short-term support for gold prices. On the other hand, strong market expectations that the Federal Reserve will maintain high interest rates, and the resulting rise in bond yields, exert sustained downward pressure. Technically, while gold prices have shown signs of short-term stabilization, the downward channel and moving average system remain effective resistance, and a sustained bullish trend is far from materializing.
Before the official release of the FOMC meeting minutes, the market will likely maintain a consolidation pattern, and any directional breakout will require a stronger catalyst. For investors, remaining patient and waiting for clearer signals before gold prices effectively break through the upper resistance or fall below the lower support may be a more prudent choice.
Question 1: Why hasn't gold prices risen significantly despite escalating geopolitical conflicts?
Geopolitical risks have a multifaceted impact on gold. While conflicts typically trigger safe-haven buying, the current tensions between the US and Iran have also driven up oil prices, exacerbated inflation concerns, and reinforced market expectations that the Federal Reserve will maintain high interest rates. Rising interest rates increase the opportunity cost of holding non-interest-bearing assets, a negative factor that largely offsets the positive pull of safe-haven demand. Furthermore, the US dollar often plays a safe-haven role during periods of turmoil, diverting funds to dollar-denominated assets and further limiting gold price gains.
Question 2: Why are the Fed meeting minutes so important for gold?
The FOMC meeting minutes meticulously record the discussions among policymakers at their policy meetings, reflecting their true views on the economic outlook, inflation risks, and the path of interest rates. The market hopes to use the minutes to gauge the pace and magnitude of future interest rate hikes. If the minutes show a stronger hawkish bias, it means interest rates may remain high for a longer period, which is bearish for gold; conversely, if the minutes reveal concerns about an economic downturn, it may suggest the rate hike cycle is nearing its end, which would be beneficial for a gold price rebound.
Question 3: Why is the 200-day moving average considered a key technical level?
The 200-day moving average is one of the most commonly used indicators for long-term trend following and is widely regarded as a dividing line between bull and bear markets. When the price is above this moving average, it usually indicates that the market is in a long-term upward trend; conversely, it indicates a long-term downward trend. Currently, this moving average is around $4485, far above the current market price, meaning that if gold prices are to reverse their long-term downward trend, they must experience a significant rise to recover this level, thus forming a strong resistance barrier.
Question 4: What is meant by a "descending channel"? How does it affect trading decisions?
A descending channel is a price trading range formed by two parallel trend lines. The upper trendline connects rebound highs, and the lower trendline connects pullback lows, forming a downward sloping pattern. This channel indicates an orderly decline in the market; rebounds near the upper trendline often encounter selling pressure, while drops near the lower trendline may find support. Traders typically use this structure for range trading, considering selling near the upper trendline and buying near the lower trendline, until the price breaks through the channel boundaries, indicating a potential trend reversal.
Question 5: Is the current rise in gold prices just a temporary rebound? How can we determine whether the rebound can continue?
Currently, it's more accurate to define this rise as a rebound rather than a reversal. To determine whether a rebound can transform into a reversal, several key signals need to be observed: First, can gold prices sustainably hold above $4100 and effectively break through the upper channel line at $4164? Second, can the RSI rise above 50, indicating strengthening bullish momentum? Third, can the positive zone of the MACD expand further? Fourth, after the release of the FOMC minutes, will changes in market expectations regarding interest rates be favorable for gold? Only when these conditions are gradually met can the continuation of the rebound be confirmed. Until then, downside risks must remain a concern.
At 15:00 Beijing time, spot gold is trading at $4124.36 per ounce.
The direct reason for stabilizing gold prices lies in the failure of the US dollar index to maintain its previous slight rebound. Although dollar bulls attempted to push higher, investors were unwilling to make excessive bets before key risk events unfolded, choosing instead to wait and see. Market attention is now focused on the upcoming release of the minutes from the Federal Open Market Committee (FOMC) June meeting, a document that may provide clearer clues about the Fed's future policy path. Under the shadow of uncertainty, the upside potential of the dollar is limited, which objectively provides some support for dollar-denominated gold.
However, it's important to recognize that the current fundamental situation is far from confirming a trend reversal. Whether the previous pullback in gold prices has completely ended remains an open question. After all, just this Monday, gold prices briefly touched a two-week high—slightly above $4,200—before encountering selling pressure and falling back. The current slight rebound is more likely to be seen as a technical correction within a downtrend, rather than the start of a new upward trend. However, if gold prices can strongly recover the $4,200 level, a larger rebound is possible.
Geopolitical tensions escalate: US-Iran conflict reignites, risk aversion fluctuates.
The recent surge in tensions in the Middle East has become a significant variable in the precious metals market. The US military launched a new round of strikes against targets in Iran on Tuesday, following reports of attacks on three oil tankers near the Strait of Hormuz. These events have seriously jeopardized the already fragile ceasefire agreement. Faced with the potential risk of escalation, traders are quickly pricing in geopolitical risk premiums across various asset classes.
Logically, geopolitical tensions usually benefit gold's safe-haven function, thus driving up its price. However, the situation is more complex this time—investors are also concerned that if the US-Iran confrontation escalates further, the dollar's status as the world's primary reserve currency may actually be strengthened, leading to capital flows into dollar assets seeking safety, which would then put downward pressure on gold. Therefore, geopolitical factors have a double-edged sword effect on gold prices, providing both support and potential risks.
Meanwhile, the US also took diplomatic action, revoking a key sanctions waiver that previously allowed Iran to sell crude oil on the international market. This move directly led to a sharp rise in crude oil prices of over 5% on Tuesday. The rise in energy prices reignited market concerns about a resurgence of inflationary pressures, and the rising inflation expectations further strengthened the market's judgment that the Federal Reserve will maintain a "higher and longer" interest rate stance. For gold, a high-interest-rate environment means an increased opportunity cost of holding non-interest-bearing assets, which is undoubtedly a significant factor suppressing gold prices in the medium to long term.
Fed Policy Expectations: Hawkish Pricing Firmly, Yield Curve Under Pressure
Judging from interest rate market pricing, traders' current expectations for the Federal Reserve's monetary policy are already quite hawkish. According to data monitored by the CME Group's FedWatch tool, the market currently believes there is an over 80% probability that the Fed will raise interest rates by at least 25 basis points before the end of this year. Such a high probability indicates that market participants generally believe that even if the US economy shows signs of cooling, the Fed will not easily back down in its determination to combat inflation.
The market also anticipates a hawkish tone in the upcoming FOMC meeting minutes. Investors generally believe the minutes may reveal concerns within policymakers about sticky inflation and caution regarding a potential backlash from premature policy easing. This expectation has directly driven US Treasury yields further upward, with the 10-year Treasury yield, a long-term benchmark, climbing to around 4.567%, and the 2-year Treasury yield, more sensitive to policy rate changes, rising to 4.189%.
Rising yields are undoubtedly good news for dollar bulls, as higher bond returns attract overseas funds to US assets, thus pushing up the dollar's exchange rate. A strong dollar, in turn, directly reduces the attractiveness of dollar-denominated gold. Furthermore, gold itself does not generate interest income; in an environment of persistently high interest rates, its relative investment value is naturally eroded. Therefore, from both interest rate and exchange rate perspectives, the current macroeconomic environment presents significant headwinds for gold.
Technical Analysis: Channel resistance remains, and the shift from bullish to bearish sentiment still needs confirmation.
From a daily chart perspective, gold prices are currently still trading within a clear downward channel and are generally below the 200-day Simple Moving Average (SMA), which is currently around $4488/oz. This suggests that the bearish tone of the medium-term trend has not fundamentally changed. However, some subtle changes have emerged in the technical indicators – the Moving Average Convergence Divergence (MACD) indicator has turned positive, which is generally considered a signal of improved short-term momentum, suggesting a potential rebound in gold prices.
However, we cannot conclude that the trend is about to reverse. The Relative Strength Index (RSI) is currently reading around 44, still below the 50-point threshold separating strength from weakness, indicating that the market's intrinsic upward momentum is insufficient and selling pressure still holds a relative advantage. In summary, any attempt at a rebound in the short term is likely to encounter heavy supply pressure near the upper channel line. Specifically, the first key resistance level is around $4164.35, which coincides with the upper edge of the short-term downtrend line.
If gold prices can convincingly break through this barrier, the next more significant test will be at the 200-day moving average, around $4488. Only a decisive break above this long-term moving average can alleviate the current broader bearish pressure from a technical perspective, thus laying the foundation for a trend reversal. On the downside, support is currently at the 9-day moving average around $4092, followed by the July 2nd low around $4030, and then the psychological level of $4000. A break below this level could open up further downside potential.
(Spot gold daily chart, source: FX678)
Summary: Bullish and bearish sentiments are mixed; awaiting guidance from the minutes.
In summary, the current gold market is caught in a complex web of interplay between multiple factors. On one hand, the cautious stance of the US dollar ahead of key risk events and the uncertainty surrounding Middle East geopolitics provide short-term support for gold prices. On the other hand, strong market expectations that the Federal Reserve will maintain high interest rates, and the resulting rise in bond yields, exert sustained downward pressure. Technically, while gold prices have shown signs of short-term stabilization, the downward channel and moving average system remain effective resistance, and a sustained bullish trend is far from materializing.
Before the official release of the FOMC meeting minutes, the market will likely maintain a consolidation pattern, and any directional breakout will require a stronger catalyst. For investors, remaining patient and waiting for clearer signals before gold prices effectively break through the upper resistance or fall below the lower support may be a more prudent choice.
Frequently Asked Questions
Question 1: Why hasn't gold prices risen significantly despite escalating geopolitical conflicts?
Geopolitical risks have a multifaceted impact on gold. While conflicts typically trigger safe-haven buying, the current tensions between the US and Iran have also driven up oil prices, exacerbated inflation concerns, and reinforced market expectations that the Federal Reserve will maintain high interest rates. Rising interest rates increase the opportunity cost of holding non-interest-bearing assets, a negative factor that largely offsets the positive pull of safe-haven demand. Furthermore, the US dollar often plays a safe-haven role during periods of turmoil, diverting funds to dollar-denominated assets and further limiting gold price gains.
Question 2: Why are the Fed meeting minutes so important for gold?
The FOMC meeting minutes meticulously record the discussions among policymakers at their policy meetings, reflecting their true views on the economic outlook, inflation risks, and the path of interest rates. The market hopes to use the minutes to gauge the pace and magnitude of future interest rate hikes. If the minutes show a stronger hawkish bias, it means interest rates may remain high for a longer period, which is bearish for gold; conversely, if the minutes reveal concerns about an economic downturn, it may suggest the rate hike cycle is nearing its end, which would be beneficial for a gold price rebound.
Question 3: Why is the 200-day moving average considered a key technical level?
The 200-day moving average is one of the most commonly used indicators for long-term trend following and is widely regarded as a dividing line between bull and bear markets. When the price is above this moving average, it usually indicates that the market is in a long-term upward trend; conversely, it indicates a long-term downward trend. Currently, this moving average is around $4485, far above the current market price, meaning that if gold prices are to reverse their long-term downward trend, they must experience a significant rise to recover this level, thus forming a strong resistance barrier.
Question 4: What is meant by a "descending channel"? How does it affect trading decisions?
A descending channel is a price trading range formed by two parallel trend lines. The upper trendline connects rebound highs, and the lower trendline connects pullback lows, forming a downward sloping pattern. This channel indicates an orderly decline in the market; rebounds near the upper trendline often encounter selling pressure, while drops near the lower trendline may find support. Traders typically use this structure for range trading, considering selling near the upper trendline and buying near the lower trendline, until the price breaks through the channel boundaries, indicating a potential trend reversal.
Question 5: Is the current rise in gold prices just a temporary rebound? How can we determine whether the rebound can continue?
Currently, it's more accurate to define this rise as a rebound rather than a reversal. To determine whether a rebound can transform into a reversal, several key signals need to be observed: First, can gold prices sustainably hold above $4100 and effectively break through the upper channel line at $4164? Second, can the RSI rise above 50, indicating strengthening bullish momentum? Third, can the positive zone of the MACD expand further? Fourth, after the release of the FOMC minutes, will changes in market expectations regarding interest rates be favorable for gold? Only when these conditions are gradually met can the continuation of the rebound be confirmed. Until then, downside risks must remain a concern.
At 15:00 Beijing time, spot gold is trading at $4124.36 per ounce.
- Risk Warning and Disclaimer
- The market involves risk, and trading may not be suitable for all investors. This article is for reference only and does not constitute personal investment advice, nor does it take into account certain users’ specific investment objectives, financial situation, or other needs. Any investment decisions made based on this information are at your own risk.