The fragility of the ceasefire triggered a surge in oil prices, and a watershed moment emerged for the strength of the US dollar index.
2026-07-08 20:52:47
On Wednesday, July 8th, the US dollar index became the most crucial risk pricing vehicle in the foreign exchange market. Currently, the US dollar index is trading around 101.15, up approximately 0.1% intraday, and is once again approaching its near one-year high.

News reports indicate that the ceasefire agreement in Iran is under renewed pressure, escalating shipping safety risks in the Strait of Hormuz and causing significant volatility in oil prices, with Brent crude briefly rising to around $79 per barrel. For the US dollar index, the energy shock is not simply a safe-haven story, but rather a simultaneous reassessment of three factors: inflation expectations, real interest rates, and pressure from non-US energy bills.
The US Dollar Index is not an average performance of the US dollar against all global currencies, but rather a weighted index composed of currencies such as the euro, yen, pound sterling, and Canadian dollar, with the euro having the highest weight, followed by the yen and pound sterling. Therefore, when energy shocks more significantly suppress the terms of trade in Europe and Japan, the US Dollar Index often receives passive support, even when the US itself faces inflationary pressures from oil prices.
The rise in the US dollar index does not necessarily mean the market is pricing in a one-way strengthening of the US macroeconomy. More accurately, the current pricing focus is on whether the Federal Reserve can continue to maintain restrictive interest rates. The Fed's June meeting decided to maintain the target range for the federal funds rate at 3.50% to 3.75%, with the upper limit of the current target range remaining at 3.75%.
This means that the short-term elasticity of the US dollar index stems more from "compressed expectations of interest rate cuts" or "re-introduction of the tail risks of interest rate hikes" than from optimism about growth. New York Fed President Williams recently stated that falling energy prices have helped ease inflationary pressures, but emphasized that policy still depends on subsequent data. Such statements leave room for market uncertainty: if the oil price shock continues, policy expectations will tighten; if housing and consumption continue to cool, the dollar's interest rate support will weaken.
This logic is reinforced on the bond market. On July 8, the yield on the 10-year US Treasury note hovered around 4.55% to 4.56%, remaining at a high level. For traders, the dollar index is currently not solely a safe-haven asset, but rather a trade on whether the "oil price shock" will translate into higher nominal interest rates. As long as long-term yields do not decline significantly, the downside potential of the dollar index is likely to be limited.
The upward movement of the US dollar index is also subject to macroeconomic constraints. The US housing market is already experiencing inventory pressure. The latest housing platform data shows that in May, there were approximately 1.2999 million units for sale, with a median listing price of about $409,600. In April, 55.5% of transactions were sold below the listing price. This indicates that the supply and demand structure in the housing market is shifting from a seller's advantage to stronger buyer bargaining power.
Regarding existing home sales, sales rose 3.2% month-over-month in May, but the larger context is that housing activity remains low, with existing home sales not yet fully recovered from the previous trough, and new home sales and starts also lacking strong expansion. For the US dollar index, this creates a medium-term contradiction: geopolitical risks and oil prices are pushing up inflation expectations, supporting the dollar; weak housing inventories and sales are suppressing domestic demand expectations, weakening the dollar's fundamental resilience.
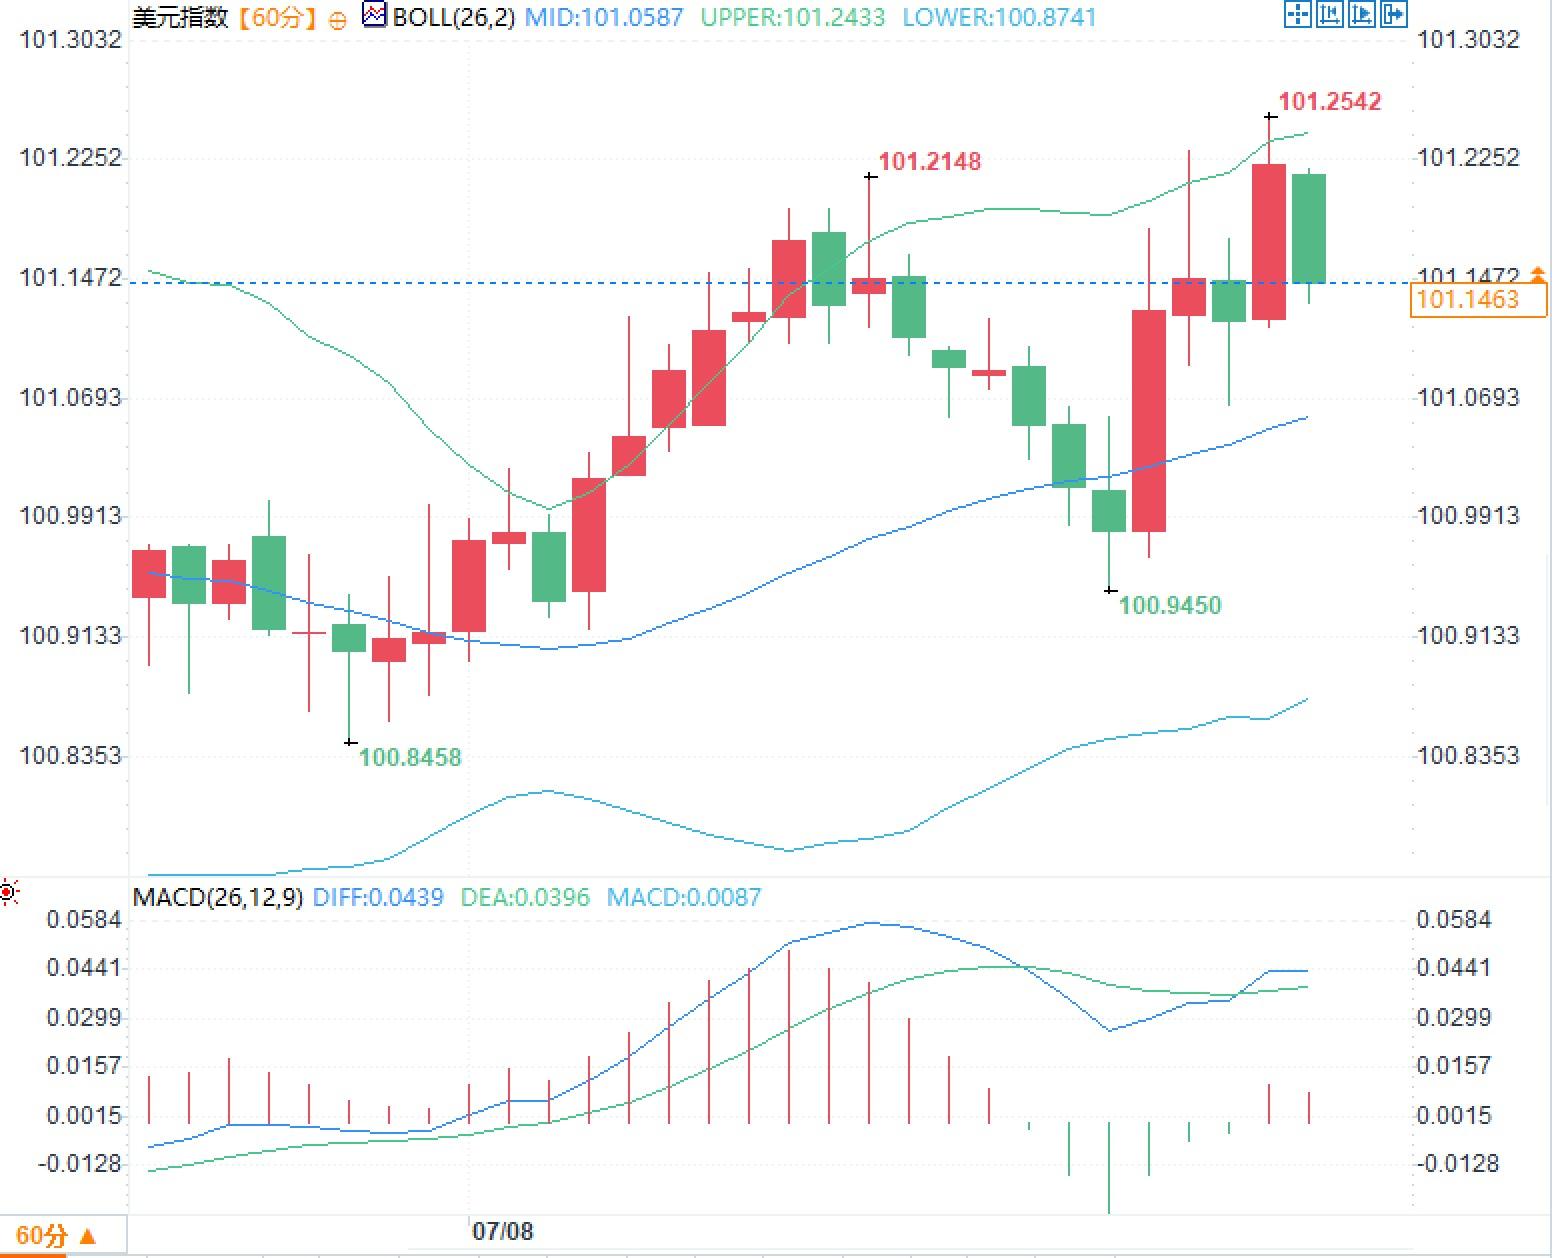
From a technical chart perspective, the 60-minute US Dollar Index is trading above the Bollinger Band middle line at 101.0587, with the upper band around 101.2433. The latest price is near 101.15, with the previous highs of 101.2542 and 101.2148 forming a short-term resistance zone. Regarding the MACD, the DIF is 0.0439, the DEA is 0.0396, and the histogram is 0.0087, indicating that momentum remains positive, but the expansion is not sufficient. In other words, the market has moved from a corrective rebound to a high-level confirmation phase. The key going forward is not a single candlestick, but whether the market can maintain its center of gravity above 101.
Risk premium has returned to the core of the dollar index pricing.
News reports indicate that the ceasefire agreement in Iran is under renewed pressure, escalating shipping safety risks in the Strait of Hormuz and causing significant volatility in oil prices, with Brent crude briefly rising to around $79 per barrel. For the US dollar index, the energy shock is not simply a safe-haven story, but rather a simultaneous reassessment of three factors: inflation expectations, real interest rates, and pressure from non-US energy bills.
The US Dollar Index is not an average performance of the US dollar against all global currencies, but rather a weighted index composed of currencies such as the euro, yen, pound sterling, and Canadian dollar, with the euro having the highest weight, followed by the yen and pound sterling. Therefore, when energy shocks more significantly suppress the terms of trade in Europe and Japan, the US Dollar Index often receives passive support, even when the US itself faces inflationary pressures from oil prices.
The Fed's path has once again become a key variable in the slope of the market trend.
The rise in the US dollar index does not necessarily mean the market is pricing in a one-way strengthening of the US macroeconomy. More accurately, the current pricing focus is on whether the Federal Reserve can continue to maintain restrictive interest rates. The Fed's June meeting decided to maintain the target range for the federal funds rate at 3.50% to 3.75%, with the upper limit of the current target range remaining at 3.75%.
This means that the short-term elasticity of the US dollar index stems more from "compressed expectations of interest rate cuts" or "re-introduction of the tail risks of interest rate hikes" than from optimism about growth. New York Fed President Williams recently stated that falling energy prices have helped ease inflationary pressures, but emphasized that policy still depends on subsequent data. Such statements leave room for market uncertainty: if the oil price shock continues, policy expectations will tighten; if housing and consumption continue to cool, the dollar's interest rate support will weaken.
This logic is reinforced on the bond market. On July 8, the yield on the 10-year US Treasury note hovered around 4.55% to 4.56%, remaining at a high level. For traders, the dollar index is currently not solely a safe-haven asset, but rather a trade on whether the "oil price shock" will translate into higher nominal interest rates. As long as long-term yields do not decline significantly, the downside potential of the dollar index is likely to be limited.
Housing inventory pressure limits the dollar's medium-term narrative
The upward movement of the US dollar index is also subject to macroeconomic constraints. The US housing market is already experiencing inventory pressure. The latest housing platform data shows that in May, there were approximately 1.2999 million units for sale, with a median listing price of about $409,600. In April, 55.5% of transactions were sold below the listing price. This indicates that the supply and demand structure in the housing market is shifting from a seller's advantage to stronger buyer bargaining power.
Regarding existing home sales, sales rose 3.2% month-over-month in May, but the larger context is that housing activity remains low, with existing home sales not yet fully recovered from the previous trough, and new home sales and starts also lacking strong expansion. For the US dollar index, this creates a medium-term contradiction: geopolitical risks and oil prices are pushing up inflation expectations, supporting the dollar; weak housing inventories and sales are suppressing domestic demand expectations, weakening the dollar's fundamental resilience.
From a technical chart perspective, the 60-minute US Dollar Index is trading above the Bollinger Band middle line at 101.0587, with the upper band around 101.2433. The latest price is near 101.15, with the previous highs of 101.2542 and 101.2148 forming a short-term resistance zone. Regarding the MACD, the DIF is 0.0439, the DEA is 0.0396, and the histogram is 0.0087, indicating that momentum remains positive, but the expansion is not sufficient. In other words, the market has moved from a corrective rebound to a high-level confirmation phase. The key going forward is not a single candlestick, but whether the market can maintain its center of gravity above 101.
- Risk Warning and Disclaimer
- The market involves risk, and trading may not be suitable for all investors. This article is for reference only and does not constitute personal investment advice, nor does it take into account certain users’ specific investment objectives, financial situation, or other needs. Any investment decisions made based on this information are at your own risk.