The Strait of Hormuz crisis fueled inflation concerns, causing gold and silver prices to surge and then retreat.
2026-07-10 22:01:57
On Friday (July 10), towards the end of the North American trading session, spot gold and silver ended the previous day's strong rebound, trending weaker and closing slightly lower. Intense competition between bulls and bears, coupled with weak US non-farm payroll data, a hawkish Fed meeting minutes, high US Treasury yields, a rebounding dollar index, and escalating geopolitical tensions in the Strait of Hormuz, led to a weakening of bullish momentum in gold and silver, resulting in a pullback after an initial surge. Spot gold traded at $4100.91 per ounce, down 0.55% on the day; spot silver traded at $59.702 per ounce, down 0.40% on the day. Gold prices had surged to $4138 in the previous trading session, completing a sharp V-shaped rebound, but today, easing risk aversion and concentrated profit-taking at higher levels put downward pressure on prices, preventing further gains.

Gold prices traded in a narrow range of $4088-$4138 per ounce today, holding above the key psychological support level of $4090 and avoiding a sharp drop. However, the rebound momentum was severely insufficient, failing to break through the core resistance range of $4162-$4214, which has become the core bottleneck for this round of gold and silver rebounds. Gold prices repeatedly tested the $4135 high but failed to stabilize, indicating a continued weakening of short-term bullish momentum and a gradually bearish market outlook. Silver traded in a range of $59.12-$60.75 per ounce today, finding support at the previous day's low and avoiding a sharp one-sided decline, but it again fell below the $60 mark. Silver possesses both commodity and financial attributes; the support from its industrial properties could not offset the downward pressure from the US dollar and US Treasury yields, resulting in an overall weak and volatile trend following gold.
The recent fluctuations in gold and silver prices are primarily driven by the interplay between macroeconomic data and policy signals. US non-farm payrolls increased by only 57,000 in June, falling short of market expectations by less than half. April and May employment data were revised downwards by a combined 74,000, and the unemployment rate remained high at 4.2%, indicating a significant cooling in the labor market. The weak employment data diminished expectations of a Fed rate hike, providing a floor for gold and silver. However, the minutes of the Fed's June meeting released hawkish signals, with officials expressing concerns that geopolitical conflicts could push up energy prices, triggering recurring inflation and slowing the pace of inflation decline.
Meanwhile, the 10-year US Treasury yield remained high at 4.54%, and the US dollar index rebounded to 100.93, continuing to suppress the upside potential of gold and silver. The offsetting forces of bulls and bears have trapped gold in a range-bound trading pattern, making it difficult for it to break out of a one-sided trend.
The situation in the Strait of Hormuz continues to deteriorate, escalating from localized skirmishes into a systemic shipping crisis and significantly increasing market inflation risk premiums. From July 8th to 9th, traffic volume in the strait plummeted to a low point, with a sharp decline in the number of oil tankers and merchant ships passing through the Persian Gulf, resulting in a significant drop in energy transport efficiency. Current shipping routes are completely fragmented, with most merchant ships avoiding the US-controlled southern route and only using the Iranian-controlled northern route. Iran has strengthened its control over the strait, requiring ships to apply for passage permits in advance and pay fees. Officials claim that the strait's traffic capacity has only recovered to 50% of pre-conflict levels, while shipping companies are exhibiting strong risk aversion, resulting in actual traffic volume far below theoretical levels.
The military standoff between the US and Iran continues to escalate without any signs of abating. From July 7th to 8th, the US military struck more than 170 key targets within Iran, prompting Iran to retaliate against multiple US military bases in the Middle East, further escalating the regional confrontation. The US and Iran's demands for control over shipping routes are completely opposed, making it difficult to break the stalemate in the short term. While the market has not yet priced in the extreme risk of a complete blockade of the Strait of Hormuz, it has already fully absorbed the disruption to energy supply caused by shipping disruptions. One-fifth of the global oil and gas supply chain has been impacted, raising the risk of rising inflation. As a result, Brent crude oil reached a high of $78.20 per barrel this week before falling back to $76.24 per barrel, while WTI crude oil closed at $72.04 per barrel, still showing a weekly increase of around 5%. The high oil prices, through the transmission logic of "rising energy prices - inflation rebound - rising US Treasury yields," continue to suppress the rebound of gold and silver prices.
The market is currently focused on three key variables: the US June CPI data on July 14th, the development of the situation in the Strait of Hormuz, and the Federal Reserve Chairman's congressional testimony. Market expectations for interest rate hikes are rising, with the probability of a Fed rate hike in September increasing to 52.7%, exacerbating policy uncertainty and causing volatility in gold and silver prices. The market outlook is clearly diverging. If the June CPI is lower than expected, the cooling inflation will ease the Fed's tightening pressure, and gold may rebound to test the resistance range of $4162-$4214. However, if oil prices continue to push up inflation, the Fed may maintain a hawkish stance, and gold will face renewed downward pressure.
Major investment banks hold significantly differing views on the future of precious metals. Goldman Sachs believes that rising energy prices are only a short-term disturbance, the downward trend in US core inflation remains unchanged, and the Federal Reserve is expected to cut interest rates in the fourth quarter, with a medium- to long-term bullish outlook for gold. Morgan Stanley, however, holds a bearish view, believing that the energy price increases caused by Middle East geopolitical conflicts are sustainable and will delay the pace of Fed rate cuts, with the high-interest-rate environment continuing to suppress short-term gold price movements. Silver's price movement is relatively independent. The stable demand from the global new energy industry and the persistent supply-demand gap have built a solid bottom for silver prices, limiting the potential for a deep decline, but it will still follow gold's volatile adjustments in the short term.
In terms of external markets, WTI crude oil closed at $71.64 per barrel, Brent crude oil at $76.08 per barrel, the US dollar index at 100.90, and the 10-year US Treasury yield remained stable at a high level of 4.54%.
Key price levels in technical analysis
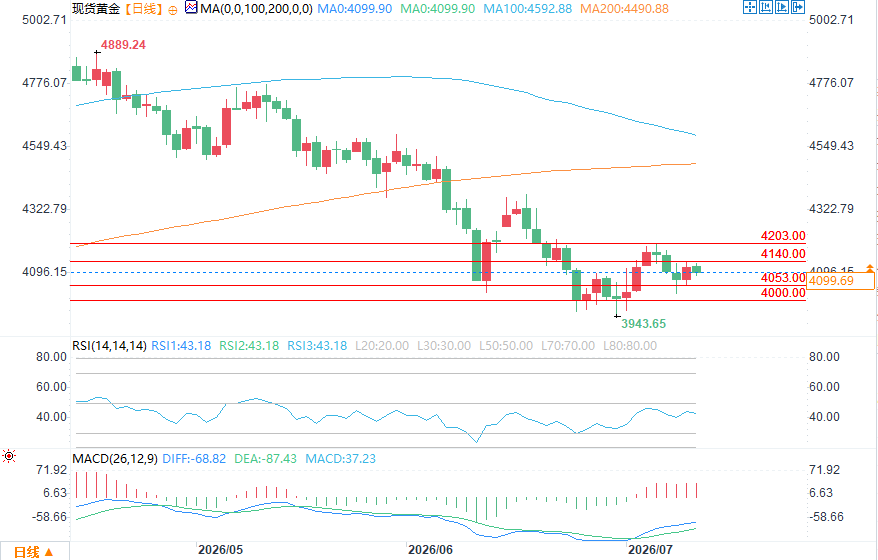
(Spot gold daily chart source: FX678)
Spot gold: If bulls hold above the $4103-$4138 range, they can target $4140 and $4203; a break above $4214 would reverse the current downtrend. If bears break below the $4090 support, they can target $4000 and a low of $3959. First resistance levels are $4138 and $4162.36; first support levels are $4088 and $4053.60, with strong support at $4021.
Spot silver: A firm hold above $59.44 could test the $63.28 resistance level, with a break above that targeting the mid-term resistance at $70.06 and $70.53. A break below the $58.53 support level would open up downside potential, with a short-term target of $55.60 and, in extreme market conditions, a drop to $50. First resistance levels are $60.75 and $63.28; first support levels are $59.12 and $58.53.
Gold prices traded in a narrow range of $4088-$4138 per ounce today, holding above the key psychological support level of $4090 and avoiding a sharp drop. However, the rebound momentum was severely insufficient, failing to break through the core resistance range of $4162-$4214, which has become the core bottleneck for this round of gold and silver rebounds. Gold prices repeatedly tested the $4135 high but failed to stabilize, indicating a continued weakening of short-term bullish momentum and a gradually bearish market outlook. Silver traded in a range of $59.12-$60.75 per ounce today, finding support at the previous day's low and avoiding a sharp one-sided decline, but it again fell below the $60 mark. Silver possesses both commodity and financial attributes; the support from its industrial properties could not offset the downward pressure from the US dollar and US Treasury yields, resulting in an overall weak and volatile trend following gold.
The recent fluctuations in gold and silver prices are primarily driven by the interplay between macroeconomic data and policy signals. US non-farm payrolls increased by only 57,000 in June, falling short of market expectations by less than half. April and May employment data were revised downwards by a combined 74,000, and the unemployment rate remained high at 4.2%, indicating a significant cooling in the labor market. The weak employment data diminished expectations of a Fed rate hike, providing a floor for gold and silver. However, the minutes of the Fed's June meeting released hawkish signals, with officials expressing concerns that geopolitical conflicts could push up energy prices, triggering recurring inflation and slowing the pace of inflation decline.
Meanwhile, the 10-year US Treasury yield remained high at 4.54%, and the US dollar index rebounded to 100.93, continuing to suppress the upside potential of gold and silver. The offsetting forces of bulls and bears have trapped gold in a range-bound trading pattern, making it difficult for it to break out of a one-sided trend.
The situation in the Strait of Hormuz continues to deteriorate, escalating from localized skirmishes into a systemic shipping crisis and significantly increasing market inflation risk premiums. From July 8th to 9th, traffic volume in the strait plummeted to a low point, with a sharp decline in the number of oil tankers and merchant ships passing through the Persian Gulf, resulting in a significant drop in energy transport efficiency. Current shipping routes are completely fragmented, with most merchant ships avoiding the US-controlled southern route and only using the Iranian-controlled northern route. Iran has strengthened its control over the strait, requiring ships to apply for passage permits in advance and pay fees. Officials claim that the strait's traffic capacity has only recovered to 50% of pre-conflict levels, while shipping companies are exhibiting strong risk aversion, resulting in actual traffic volume far below theoretical levels.
The military standoff between the US and Iran continues to escalate without any signs of abating. From July 7th to 8th, the US military struck more than 170 key targets within Iran, prompting Iran to retaliate against multiple US military bases in the Middle East, further escalating the regional confrontation. The US and Iran's demands for control over shipping routes are completely opposed, making it difficult to break the stalemate in the short term. While the market has not yet priced in the extreme risk of a complete blockade of the Strait of Hormuz, it has already fully absorbed the disruption to energy supply caused by shipping disruptions. One-fifth of the global oil and gas supply chain has been impacted, raising the risk of rising inflation. As a result, Brent crude oil reached a high of $78.20 per barrel this week before falling back to $76.24 per barrel, while WTI crude oil closed at $72.04 per barrel, still showing a weekly increase of around 5%. The high oil prices, through the transmission logic of "rising energy prices - inflation rebound - rising US Treasury yields," continue to suppress the rebound of gold and silver prices.
The market is currently focused on three key variables: the US June CPI data on July 14th, the development of the situation in the Strait of Hormuz, and the Federal Reserve Chairman's congressional testimony. Market expectations for interest rate hikes are rising, with the probability of a Fed rate hike in September increasing to 52.7%, exacerbating policy uncertainty and causing volatility in gold and silver prices. The market outlook is clearly diverging. If the June CPI is lower than expected, the cooling inflation will ease the Fed's tightening pressure, and gold may rebound to test the resistance range of $4162-$4214. However, if oil prices continue to push up inflation, the Fed may maintain a hawkish stance, and gold will face renewed downward pressure.
Major investment banks hold significantly differing views on the future of precious metals. Goldman Sachs believes that rising energy prices are only a short-term disturbance, the downward trend in US core inflation remains unchanged, and the Federal Reserve is expected to cut interest rates in the fourth quarter, with a medium- to long-term bullish outlook for gold. Morgan Stanley, however, holds a bearish view, believing that the energy price increases caused by Middle East geopolitical conflicts are sustainable and will delay the pace of Fed rate cuts, with the high-interest-rate environment continuing to suppress short-term gold price movements. Silver's price movement is relatively independent. The stable demand from the global new energy industry and the persistent supply-demand gap have built a solid bottom for silver prices, limiting the potential for a deep decline, but it will still follow gold's volatile adjustments in the short term.
In terms of external markets, WTI crude oil closed at $71.64 per barrel, Brent crude oil at $76.08 per barrel, the US dollar index at 100.90, and the 10-year US Treasury yield remained stable at a high level of 4.54%.
Key price levels in technical analysis
(Spot gold daily chart source: FX678)
Spot gold: If bulls hold above the $4103-$4138 range, they can target $4140 and $4203; a break above $4214 would reverse the current downtrend. If bears break below the $4090 support, they can target $4000 and a low of $3959. First resistance levels are $4138 and $4162.36; first support levels are $4088 and $4053.60, with strong support at $4021.
Spot silver: A firm hold above $59.44 could test the $63.28 resistance level, with a break above that targeting the mid-term resistance at $70.06 and $70.53. A break below the $58.53 support level would open up downside potential, with a short-term target of $55.60 and, in extreme market conditions, a drop to $50. First resistance levels are $60.75 and $63.28; first support levels are $59.12 and $58.53.
- Risk Warning and Disclaimer
- The market involves risk, and trading may not be suitable for all investors. This article is for reference only and does not constitute personal investment advice, nor does it take into account certain users’ specific investment objectives, financial situation, or other needs. Any investment decisions made based on this information are at your own risk.