What changes occurred in the pricing anchor of gold after the deep pullback?
2026-07-13 18:16:12
On Monday, July 13th, in early European trading, spot gold continued its decline for the second consecutive trading day. It was currently trading around $4070 per ounce, down approximately 1.2% on the day. During the same period, Brent crude oil rose to $77.5 per barrel, and the US dollar index hovered around 100.90. The risk of passage through the Strait of Hormuz has re-entered the energy, inflation, and interest rate curves. Gold has not benefited from the escalating conflict, indicating that the dominant variable has shifted from simple safe-haven demand to real interest rates and liquidity constraints. 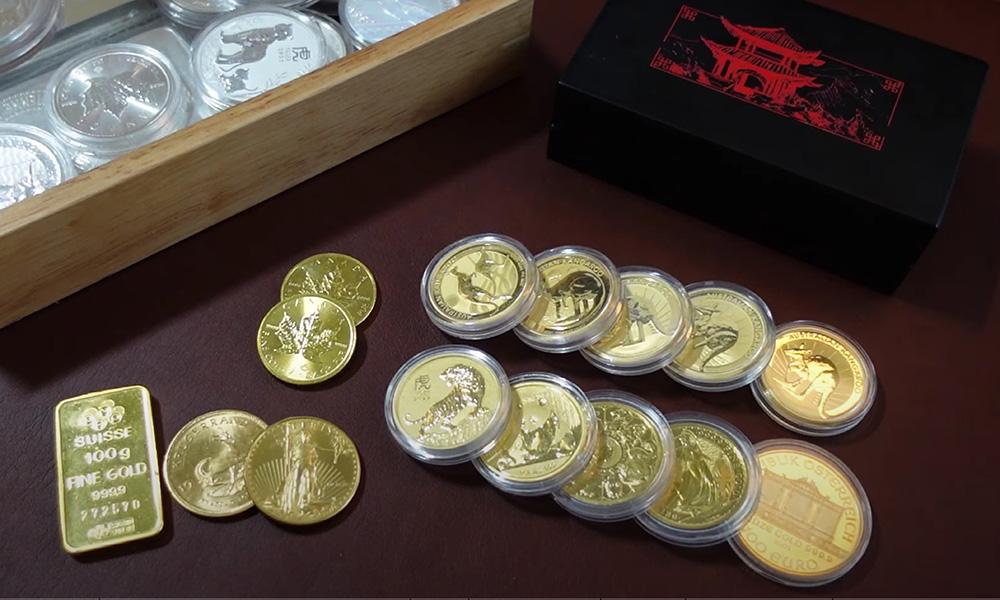
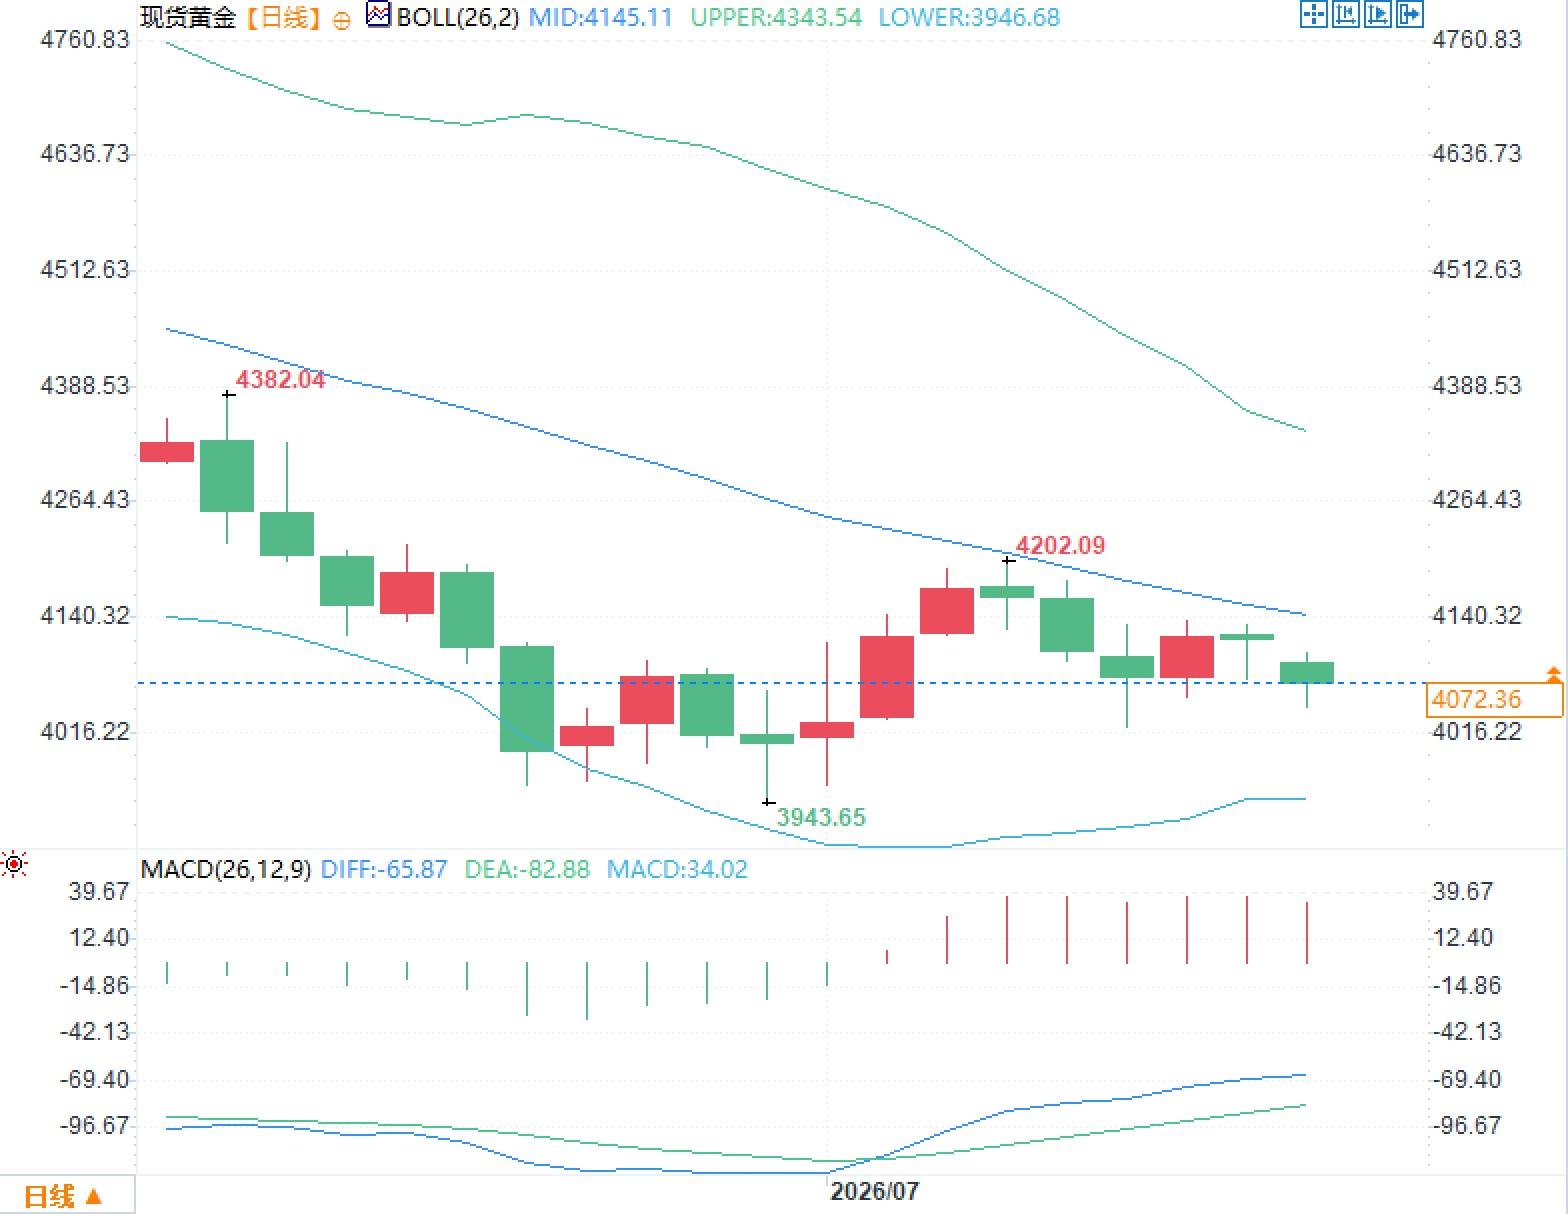 The MACD DIFF is -65.87, DEA is -82.88, and the histogram has turned to +34.02, indicating a contraction in downward momentum. However, both lines are still below the zero line, suggesting a more accurate assessment of an oversold correction rather than a trend reversal. The $4140-$4202 area reflects short-term supply pressure, while the $3943-$4000 area is the key equilibrium zone in the current volatility structure. The Bollinger Bands are still sloping downwards, meaning that even if prices experience a rapid pullback, the middle band needs to flatten and volatility need to converge to confirm that the market has transitioned from unilateral deleveraging to stable consolidation.
Why did gold fall as the conflict escalated?
Safe-haven demand is not a sufficient condition for a rise in gold prices. If a shock primarily suppresses growth and prices, funds typically flow into gold; if the shock first raises costs for oil, transportation, and insurance, the market will increase expectations for inflation and policy interest rates. Gold does not earn interest, and when nominal yields rise, expectations of interest rate cuts recede, and the dollar strengthens, the opportunity cost of holding gold increases simultaneously. The simultaneous occurrence of energy shocks, rising yields, and a strong dollar is sufficient to temporarily suppress safe-haven buying. The deeper logic is that supply-side inflation will first raise real interest rates; only when the market begins to doubt the ability of monetary policy to suppress inflation, or when growth losses significantly outweigh price shocks, can gold's monetary attributes regain their dominance.The Federal Reserve's reaction function becomes the core of pricing.
The Federal Reserve maintained the target range for the federal funds rate at 3.50% to 3.75% at its June meeting. The minutes showed that inflation risks remained skewed to the upside, while downside risks to employment had eased somewhat. A minority of policymakers believed there were reasons to raise rates, but still supported holding rates steady for the time being. The minutes also showed that overall personal consumption expenditures (PCE) rose 3.8% year-over-year in April, and the core index was 3.3%. Staff estimated that the overall index would rise to 4.1% and the core index to 3.4% in May. Interest rate futures currently price in a 71% probability of a Fed rate hike in September, up from about 63% the previous week. This means that gold faces not only the prospect of higher interest rates lasting longer, but also the repricing of the tail risk of renewed policy tightening. If subsequent consumer price, producer price, and retail data continue to reflect cost transmission, short-term interest rates may be more sensitive than long-term rates, and the repricing of the yield curve will directly affect the cost of holding gold.The technical structure remains weak and is undergoing repair.
The daily chart shows the Bollinger Bands with the middle band at $4145.11/oz, the upper band at $4343.54/oz, and the lower band at $3946.68/oz. The current price remains below the middle band. The previous low of $3943.65/oz almost coincided with the lower band, and the rebound high of $4202.09/oz failed to reverse the downward trend of the middle band. The earlier high of $4382.04/oz constitutes a higher-level consolidation zone. The MACD DIFF is -65.87, DEA is -82.88, and the histogram has turned to +34.02, indicating a contraction in downward momentum. However, both lines are still below the zero line, suggesting a more accurate assessment of an oversold correction rather than a trend reversal. The $4140-$4202 area reflects short-term supply pressure, while the $3943-$4000 area is the key equilibrium zone in the current volatility structure. The Bollinger Bands are still sloping downwards, meaning that even if prices experience a rapid pullback, the middle band needs to flatten and volatility need to converge to confirm that the market has transitioned from unilateral deleveraging to stable consolidation.The contraction in open positions indicates that deleveraging is not yet over.
As of July 7, net speculative long positions in gold fell to 114,854 contracts, a decrease of 1,964 contracts from the previous week. More notably, while long positions increased by 1,320 contracts to 134,791 contracts, short positions increased by 3,283 contracts to 19,937 contracts, indicating that the decline in net long positions was not simply a withdrawal, but rather a faster increase in new hedging and directional short positions. Since the start of the US-Iran conflict in late February, gold prices have cumulatively retreated by more than 20%, and even fell below $4,000/ounce for the first time since November 2025. Profit-taking after three years of gains, margin constraints due to increased volatility, and thin summer liquidity have collectively amplified price elasticity. Subsequent pricing will depend on whether crude oil can remain at high levels, whether short-term yields continue to rise, and whether inflation data can verify the transmission of energy costs to core prices. If the position structure continues to show that short positions are growing faster than long positions, any safe-haven rebound may first encounter inventory and hedging activity, rather than immediately forming a sustained trend.- Risk Warning and Disclaimer
- The market involves risk, and trading may not be suitable for all investors. This article is for reference only and does not constitute personal investment advice, nor does it take into account certain users’ specific investment objectives, financial situation, or other needs. Any investment decisions made based on this information are at your own risk.