With only six ships remaining to pass through the key strait, what is the crude oil market reassessing?
2026-07-13 19:08:10
On Monday, July 13, the crude oil market re-entered a pricing phase driven by shipping safety rather than traditional inventory levels. Escalating tensions between the US and Iran led to a sharp drop in commercial shipping traffic in the Strait of Hormuz, with Brent crude currently trading above $78 per barrel, up approximately 3.4% on the day. 
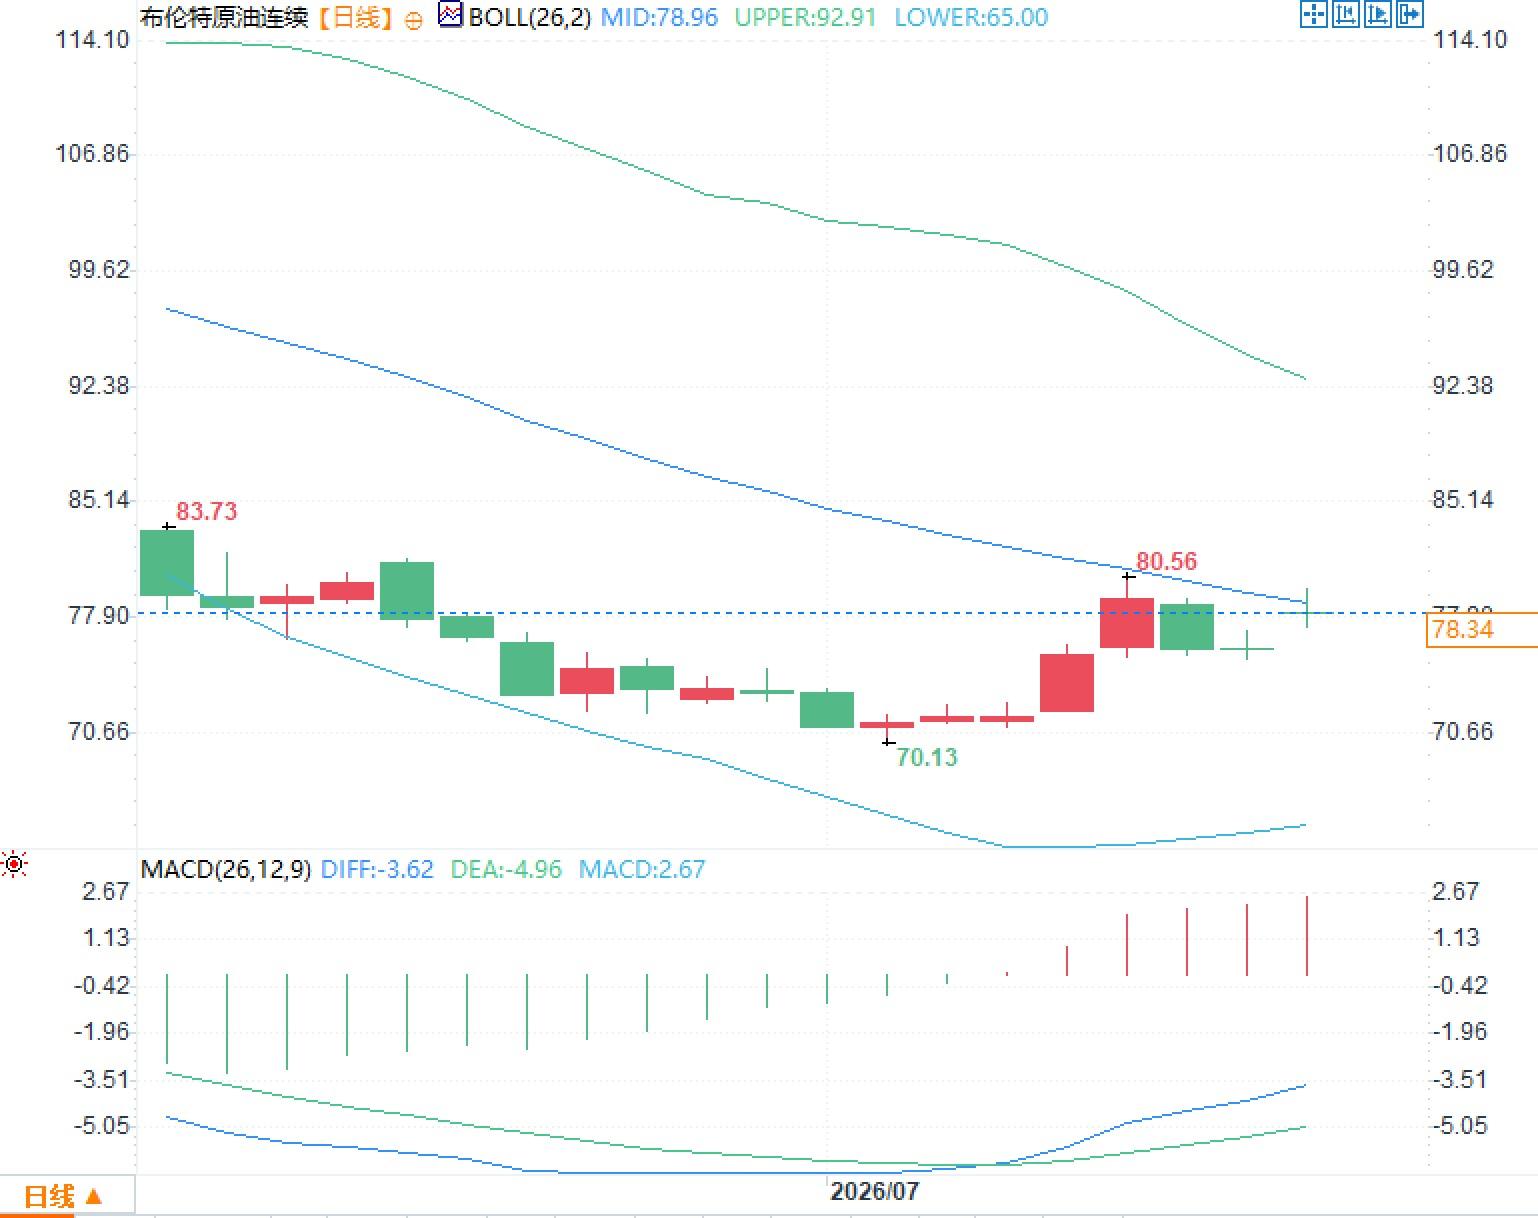 From the daily chart, Brent crude oil has rebounded from $70.13/barrel to around $78/barrel, with a recent high of $80.56/barrel. The price is currently slightly below the Bollinger Band middle line at $78.96/barrel, indicating that the rebound has corrected the short-term oversold condition, but has not yet fully reversed the medium-term downtrend. The MACD histogram has risen to positive values, but the DIFF and DEA are still below the zero line, indicating a more likely recovery of momentum within a weak range rather than a confirmed new trend. The area around $80.56/barrel represents a concentrated area of resistance from the previous rebound, while $78.96/barrel is the central point for short-term repricing.
The core issue behind rising oil prices is not production cuts, but the probability of shipping lane failures.
This round of price increases differs from routine production adjustments. The market is reassessing whether the Strait of Hormuz can maintain stable, continuous, and insurable commercial navigation. Data shows that recently, the strait typically sees 30 to 40 vessels passing through daily, but last Sunday only six vessels completed the passage, a five-week low. Some vessels may also have turned off their Automatic Identification System (AIS), so the publicly reported number of passages may not reflect the actual number. However, the directional signal is clear: shipowners, cargo owners, and insurance institutions are actively reducing their risk exposure. Crude oil pricing is composed of three layers of costs. The first layer is actual supply disruptions; the second layer is increased freight, insurance, and waiting times; and the third layer is the risk premium corresponding to the probability of future disruptions. Currently, the losses from the first layer have not been fully confirmed, but the second and third layers have already been incorporated into prices. Even if some tankers can pass along the Omani coastal route, the spot market will struggle to operate at normal efficiency unless escort, insurance, and loading schedules are restored. Therefore, the market's focus is no longer on whether the strait is nominally "open," but rather on whether vessels can pass through in a large-scale, low-risk manner. If traffic volume remains in the single digits for an extended period, even if oil fields do not cease production, output may be forced to be reduced due to storage tanks approaching their capacity limits, and supply risks will be transmitted from logistical constraints to the production end.Supply recovery is still incomplete, and the risk premium has a realistic basis.
The latest monthly data shows that global crude oil supply in June rebounded by 4.1 million barrels per day (bpd) from May to 98.8 million bpd, mainly due to a phased recovery in exports from the Gulf region. However, this level is still 9.4 million bpd lower than before the conflict. Full-year supply is projected to decrease by approximately 3.7 million bpd, while global demand is projected to decrease by approximately 1 million bpd, indicating that the current market is experiencing a supply contraction that outweighs the demand decline. This structure explains why oil prices have not fallen significantly despite the weak demand outlook. The market is not ignoring demand, but rather believing that shipping restrictions could cause a faster and more concentrated supply shock. Meanwhile, the oil-producing alliance plans to increase production adjustments by 188,000 bpd in August. This amount has a marginal impact on the normal market but is unlikely to offset the potential million-barrel-level shortfall caused by the obstruction of major shipping routes. The real variable that could compress risk premiums is not verbal cooling measures, but rather a sustained increase in ship traffic, improved insurance conditions, and shorter loading port waiting times. Until these indicators are validated, the downside for oil prices is likely to be supported by risk premiums, but the upside is also constrained by expectations of demand contraction and production recovery.Inventory levels appear loose, but the structure of refined oil products is tightening.
As of the week ending July 3, U.S. commercial crude oil inventories increased by 3 million barrels to 411.4 million barrels, superficially a bearish signal. However, this inventory level is still about 6% lower than the five-year average for the same period. More noteworthy is the decrease in gasoline inventories by 1.9 million barrels and the decrease in middle distillate inventories by 5 million barrels, the latter being about 12% lower than the five-year average. Refinery utilization reached 95.8%, with an average daily crude oil processing volume of approximately 17 million barrels. This data reveals a key contradiction in the current oil market: crude oil inventories can increase in the short term, but refined product inventories are still being rapidly depleted. High utilization rates mean that refineries are already nearing seasonally high operating rates, with limited room for further increases in processing volume. If shipping risks affect the supply of diesel, jet fuel, and feedstock, refined product crack spreads may be more sensitive than crude oil prices. Therefore, observing changes in crude oil inventories alone can easily underestimate the degree of market tension. More attention should be paid to middle distillate inventories, refinery operating rates, cargo delays, and near-month spreads. If the increase in crude oil inventories is mainly due to export disruptions rather than a decline in demand, its implications are completely different from traditional inventory accumulation.Inflation data and technical structures will amplify short-term volatility.
The U.S. June Consumer Price Index (CPI) is scheduled for release on July 14. If the data is higher than expected, the market may reassess the Federal Reserve's interest rate path; higher financing costs and downward revisions to growth expectations will suppress long-term oil demand. However, energy prices themselves may push up inflation expectations, creating a more complex linkage between crude oil, bond yields, and the dollar. If inflation is lower than expected, the reduced risk of deflation may improve risk appetite for commodities, but this will not be enough to replace the dominant role of the Straits Times data. From the daily chart, Brent crude oil has rebounded from $70.13/barrel to around $78/barrel, with a recent high of $80.56/barrel. The price is currently slightly below the Bollinger Band middle line at $78.96/barrel, indicating that the rebound has corrected the short-term oversold condition, but has not yet fully reversed the medium-term downtrend. The MACD histogram has risen to positive values, but the DIFF and DEA are still below the zero line, indicating a more likely recovery of momentum within a weak range rather than a confirmed new trend. The area around $80.56/barrel represents a concentrated area of resistance from the previous rebound, while $78.96/barrel is the central point for short-term repricing.
- Risk Warning and Disclaimer
- The market involves risk, and trading may not be suitable for all investors. This article is for reference only and does not constitute personal investment advice, nor does it take into account certain users’ specific investment objectives, financial situation, or other needs. Any investment decisions made based on this information are at your own risk.