Why has the euro entered a range-bound trading pattern after rebounding from 1.1324?
2026-07-15 16:38:11
On Wednesday, July 15th, the euro was trading around 1.1420 against the US dollar, but remained below the middle Bollinger Band on the daily chart. Brent crude oil also returned to around $86 per barrel during the same period. On the macro level, Eurozone inflation fell to 2.8% in June from 3.2% in May, while the US Consumer Price Index (CPI) slowed to 3.5% year-on-year in June, a decrease of 0.4% month-on-month. Both sets of inflation data showed a cooling trend, but the rebound in energy prices in July prevented the foreign exchange market from simply relying on the old logic of "falling inflation and cooling interest rate hikes." 
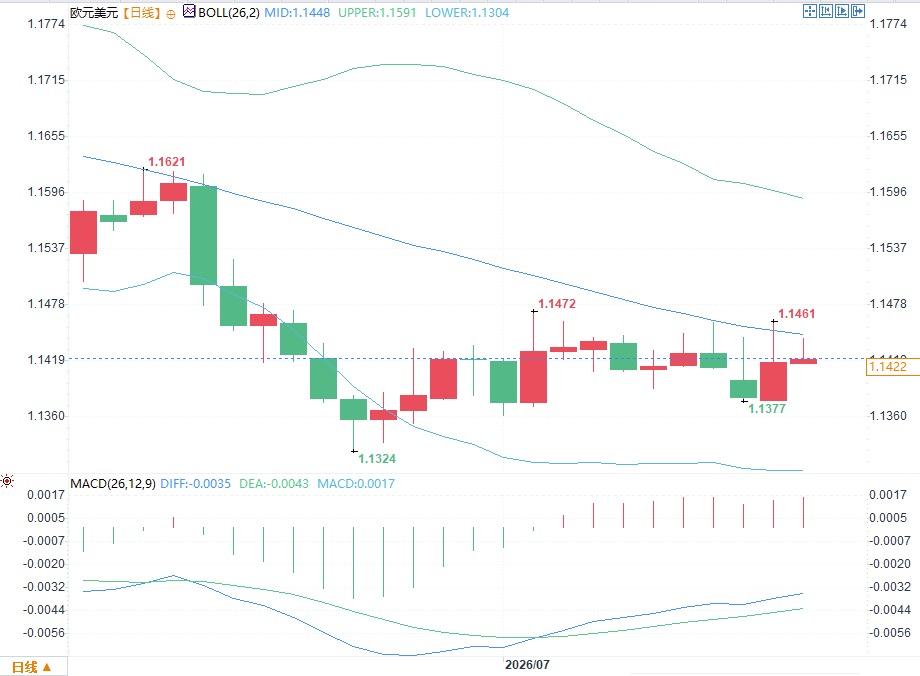 In terms of MACD, the DIFF is -0.0035, the DEA is -0.0043, and the histogram has turned to +0.0017, indicating weakening downward momentum. However, both lines are still below the zero axis, so this cannot be equated with a medium-term trend reversal. The technical and fundamental signals are highly consistent: the market acknowledges the possibility of continued tightening by the ECB, but is not yet certain that the energy shock will further erode growth. The 1.1448 to 1.1472 area reflects whether the policy premium can outweigh the growth discount, while the 1.1377 to 1.1324 area corresponds to the strength of support should risk appetite and growth expectations deteriorate again.
Oil price shocks have once again become the dominant variable for the euro.
European Central Bank Governing Council member Stournaras recently stated that the renewed escalation of the Middle East conflict has plunged the inflation and growth outlook back into uncertainty. For the Eurozone, a net energy importer, rising oil prices are not simply a positive factor for inflation, but rather a typical negative supply shock. Increased energy import costs first push up prices in transportation, chemicals, food, and utilities, and may subsequently lead to secondary transmission through business costs, wage negotiations, and service prices. Simultaneously, declining real income, squeezed corporate profits, and weakening confidence will drag down demand. This means the euro faces two opposing pricing chains. One is that rising oil prices push up inflation expectations, leading the market to increase its valuation of the ECB's terminal interest rate, providing support for the euro through short-term interest rate differentials. The other is that deteriorating terms of trade and downward revisions to growth expectations suppress the risk-adjusted returns of euro assets. The current failure of the exchange rate to rise significantly in line with interest rate hike expectations indicates that the growth discount is offsetting the policy premium.The European Central Bank faces a double whammy of rising inflation and declining growth.
The European Central Bank (ECB) raised three key interest rates by 25 basis points in June, bringing the deposit facility rate, main refinancing rate, and marginal lending rate to 2.25%, 2.40%, and 2.65%, respectively. The latest baseline forecasts show that Eurozone real GDP will grow by 0.8% in 2026, 1.2% in 2027, and 1.5% in 2028; headline inflation is projected at 3.0%, 2.3%, and 2.0%, respectively. More importantly, the June inflation drop to 2.8% has not eased policy pressure. This figure remains above the 2% target and primarily reflects the previous rapid decline in energy prices. If the continued rise in crude oil prices in July impacts the refined oil, electricity, logistics, and food chains, the ECB will have to determine whether this is a negligible short-term shock or will alter the sustainability of wage and service inflation. Therefore, the July 22-23 meeting is more likely to serve as a recalibration of the policy response function than a simple commitment to continuous rate hikes.Why didn't the interest rate differential logic translate into a one-sided trend in the Euro?
The Federal Reserve's current target range for the federal funds rate is 3.50% to 3.75%, still higher than the European Central Bank's. However, US overall inflation declined month-on-month in June, with core inflation falling to 2.6% year-on-year, reducing the urgency for further tightening in the near term. Therefore, the core issue for the euro/dollar exchange rate is not which central bank is more accommodative, but rather which side's policy expectations are adjusting faster. If the rising expectations of an ECB rate hike are mainly due to energy shocks rather than increased demand and wages, the interest rate differential support for the euro will typically be partially offset by the growth risk discount. Conversely, while cooling US inflation weakens support for dollar interest rates, a rebound in oil prices may limit the Fed's room for easing. With both policy curves steepening simultaneously, the exchange rate is more likely to remain within a range.The daily chart structure indicates that the market is still awaiting macroeconomic confirmation.
On the daily chart, the EUR/USD pair has entered a sideways consolidation phase after rebounding from 1.1324. The latest price is around 1.1420, with the Bollinger Band middle line at 1.1448, the upper band at 1.1591, and the lower band at 1.1304. 1.1461 and 1.1472 form recent strong resistance levels, while 1.1377 is the recent low. The pair's repeated consolidation around the middle band indicates that the rebound has not yet translated into a trend correction. In terms of MACD, the DIFF is -0.0035, the DEA is -0.0043, and the histogram has turned to +0.0017, indicating weakening downward momentum. However, both lines are still below the zero axis, so this cannot be equated with a medium-term trend reversal. The technical and fundamental signals are highly consistent: the market acknowledges the possibility of continued tightening by the ECB, but is not yet certain that the energy shock will further erode growth. The 1.1448 to 1.1472 area reflects whether the policy premium can outweigh the growth discount, while the 1.1377 to 1.1324 area corresponds to the strength of support should risk appetite and growth expectations deteriorate again.
- Risk Warning and Disclaimer
- The market involves risk, and trading may not be suitable for all investors. This article is for reference only and does not constitute personal investment advice, nor does it take into account certain users’ specific investment objectives, financial situation, or other needs. Any investment decisions made based on this information are at your own risk.