US Dollar Analysis: Hormuz Strait and Red Sea Risks Combined – What Is the Market Ignoring?
2026-07-21 21:06:16
On Tuesday, July 21, the foreign exchange market was reassessing the transmission relationship between the Middle East conflict, oil supply risks, and the Federal Reserve's policy path. The US dollar index was last quoted around 101, with the daily chart still fluctuating around the Bollinger Band middle line at 100.9537. Meanwhile, Brent crude oil was trading around $91 per barrel, and the yield on the 10-year US Treasury bond was approximately 4.59%. Although the ceasefire news initially depressed oil prices, US President Trump reportedly rejected a 10-day ceasefire proposal, causing the energy risk premium to re-enter the pricing range. 
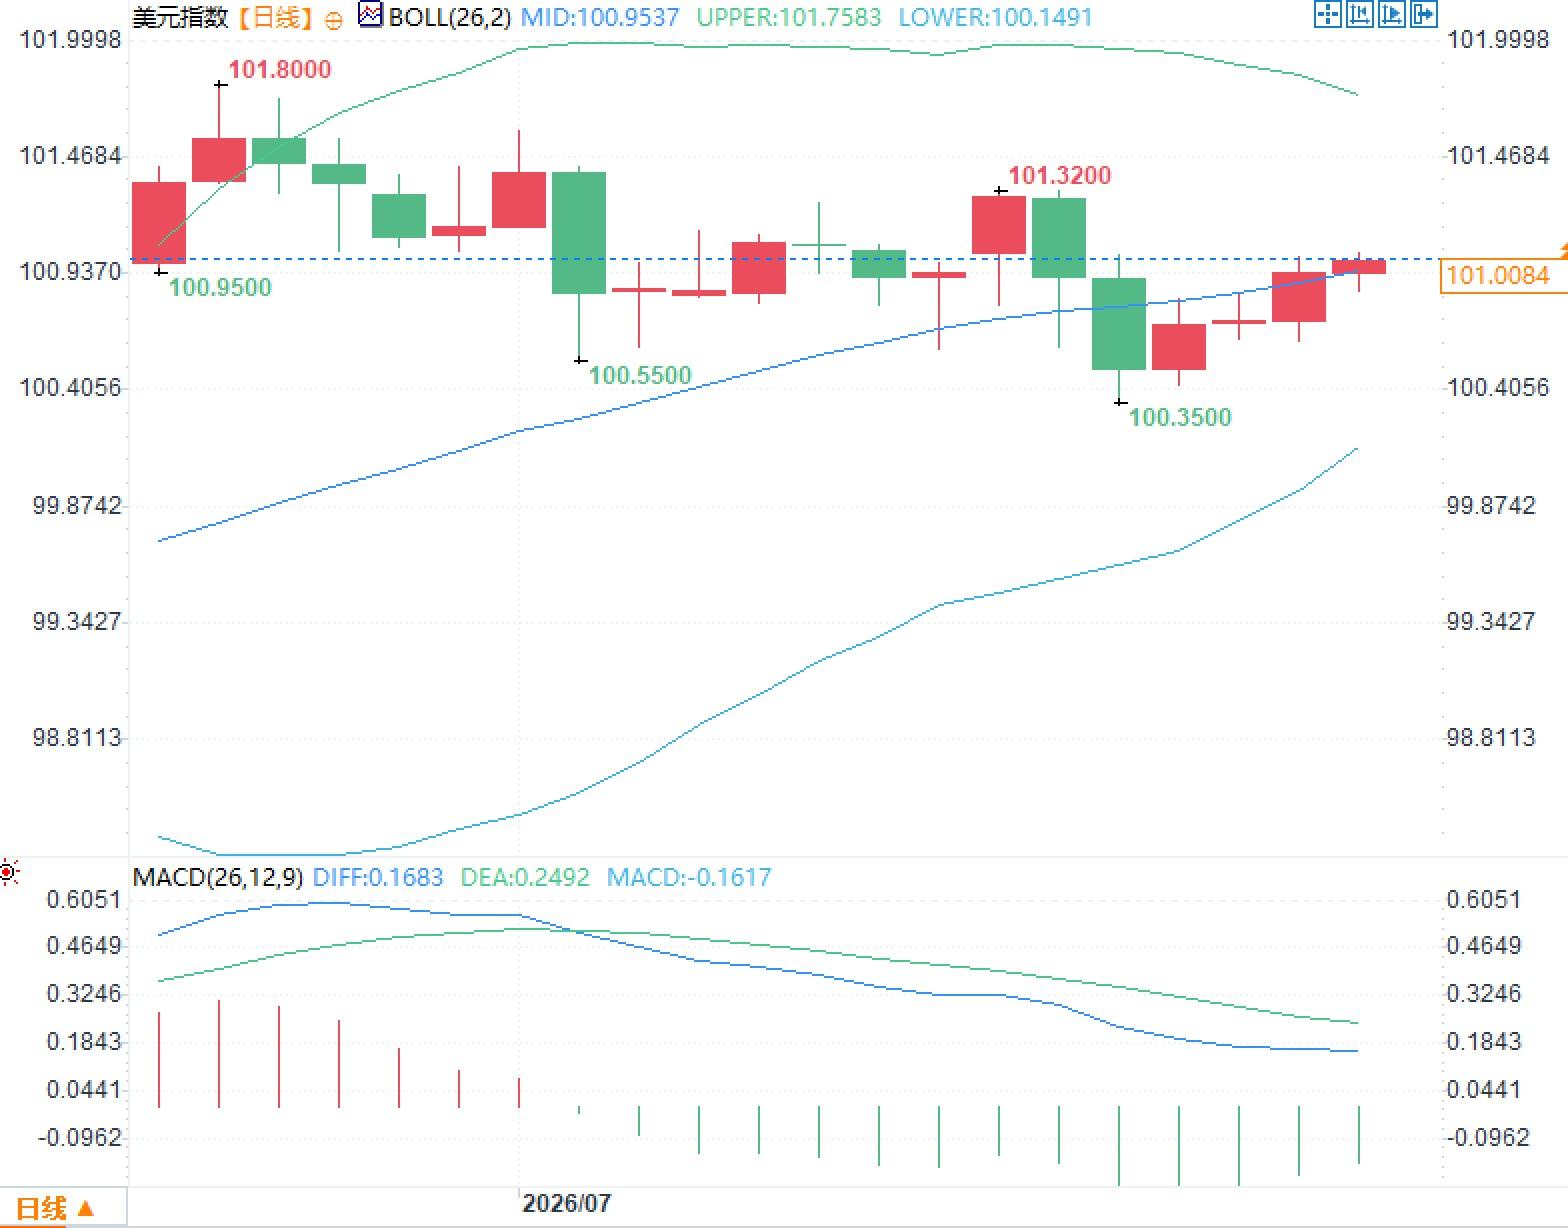
The US dollar index is caught in a multi-faceted hedging mechanism.
The US dollar has not yet formed a typical one-sided safe-haven trend because several macroeconomic factors are offsetting each other. Escalating conflicts usually lead to liquidity demand, boosting the dollar's short-term safe-haven attributes; however, if oil prices continue to rise, US import costs and inflation expectations will also rise simultaneously, further increasing long-term interest rates and fiscal financing pressures. In this situation, the dollar may initially be supported by yields, and then constrained by actual growth expectations and asset valuation adjustments. The dollar index is at 101, indicating that the market currently views geopolitical risks as a controllable disturbance rather than a global liquidity crisis. The euro remains stable around $1.142, also reflecting that there are no signs of a full-scale withdrawal of funds from non-dollar assets. The Bollinger Bands in the chart have a middle band at 100.9537, an upper band at 101.7583, and a lower band at 100.1491. The index is running close to the middle band, indicating that the trend direction has not yet been confirmed. 101.32 is the recent rebound high, while 101.80 corresponds to a stronger previous resistance area; 100.55 and 100.35 constitute the low points of the current fluctuation. The price structure is closer to event-driven range compression than the starting point of a trend.Ceasefire expectations fluctuate, and crude oil becomes the key to dollar pricing.
Whether the 10-day ceasefire agreement between the US and Iran is implemented will determine not only intraday fluctuations in crude oil prices, but also how the foreign exchange market assesses a second round of inflation. Recent reports indicate that multiple parties are pushing for a temporary ceasefire, but none have formally accepted it. The market's real focus is on whether the Strait of Hormuz and Red Sea shipping routes will be simultaneously disrupted. If insurance rates, shipping schedules, and detour costs for both shipping routes continue to rise, even if spot supply is not immediately interrupted, the forward curve may already factor in logistics premiums. For the US dollar, rising oil prices are not purely bullish. The initial reaction is usually a rise in safe-haven demand and nominal yields, but if energy prices continue to erode real income, growth expectations may weaken. Whether the US dollar can break through 101.32 depends not on a single conflict headline, but on whether the oil price shock remains at the level of risk premiums or transmits to inflation, consumption, and the Federal Reserve's response function.The 3% growth target is unlikely to change the interest rate constraint.
U.S. Treasury Secretary Bessant stated that a 3% economic growth target is not unreasonable. This statement conveyed a positive assessment of productivity, investment, and fiscal policy to the market, but the trading floor will not reassess the dollar's central value solely based on verbal targets. Currently, the yield on the 10-year U.S. Treasury note is approximately 4.59%, up about 44 basis points from the beginning of the year, indicating that the bond market still demands higher maturity compensation. The Federal Reserve's target range for the federal funds rate has remained between 3.50% and 3.75% since the beginning of the year, and it believes that economic activity is still expanding at a robust pace, but uncertainty stemming from the Middle East conflict remains high. This means that the 3% growth narrative faces two constraints. First, if growth comes from improvements in real productivity, the dollar may receive fundamental support; second, if growth relies on higher fiscal spending and stronger nominal demand, inflation stickiness and pressure on Treasury supply may rise simultaneously. The latter will raise long-term yields but may not sustainably boost the dollar, as high financing costs will conversely suppress real estate, durable goods consumption, and corporate valuations.Technical analysis indicates that the rebound momentum has not yet been restored.
In the chart, the MACD indicator shows a DIFF of 0.1683, a DEA of 0.2492, and a histogram value of -0.1617. The DIFF is below the DEA, indicating that medium-term momentum remains weak. It's worth noting that the negative histogram hasn't expanded rapidly, and the price has regained the Bollinger Band's middle band, suggesting that bearish momentum is slowing, but the bulls haven't yet established a trend advantage. The upper Bollinger Band is starting to curve slightly downwards, while the lower band is rising significantly, indicating a continuously narrowing trading range. This type of structure typically means the market is awaiting new information variables, including the outcome of ceasefire negotiations, oil shipping status, inflation data, and the Fed's interest rate meeting on July 28-29. Therefore, the area around 100.95 is not only a technical pivot point but also a macroeconomic pricing boundary. The index remaining above this level indicates that safe-haven demand and yield factors still hold some weight; a break below 100.55 suggests the market is placing more emphasis on cooling growth and policy expectations. If the 101.32 to 101.80 area is repeatedly blocked, it indicates that the conflict premium is insufficient to drive the US dollar into a trend of appreciation.- Risk Warning and Disclaimer
- The market involves risk, and trading may not be suitable for all investors. This article is for reference only and does not constitute personal investment advice, nor does it take into account certain users’ specific investment objectives, financial situation, or other needs. Any investment decisions made based on this information are at your own risk.