Gold prices surged near $4150 as a glimmer of hope for US-Iran diplomacy ignited bullish sentiment, but the Federal Reserve seemed poised to dampen the enthusiasm.
2026-07-22 14:02:14
International gold prices continued their short-term bullish trend in Asian trading on Monday (July 22), briefly hitting a two-week high of around $4141.59 per ounce, just shy of the 200-period moving average on the 4-hour chart. They have since retreated slightly to around $4130 per ounce. Market sentiment is in a delicate balance: on the one hand, the market hopes that US-Iran diplomacy can ease energy prices and mitigate hawkish expectations from the Federal Reserve, providing an opportunity for a gold price rebound; on the other hand, ongoing geopolitical friction and the persistently high probability of interest rate hikes are making gold bulls hesitant. The US dollar index paused its gains after four consecutive days of strength, providing breathing room for the gold price rebound. The core contradiction lies in investors weighing the possibility of the Federal Reserve maintaining a tight stance to curb energy-driven inflation against the geopolitical risk premium of uncertainty surrounding the US-Iran situation. 
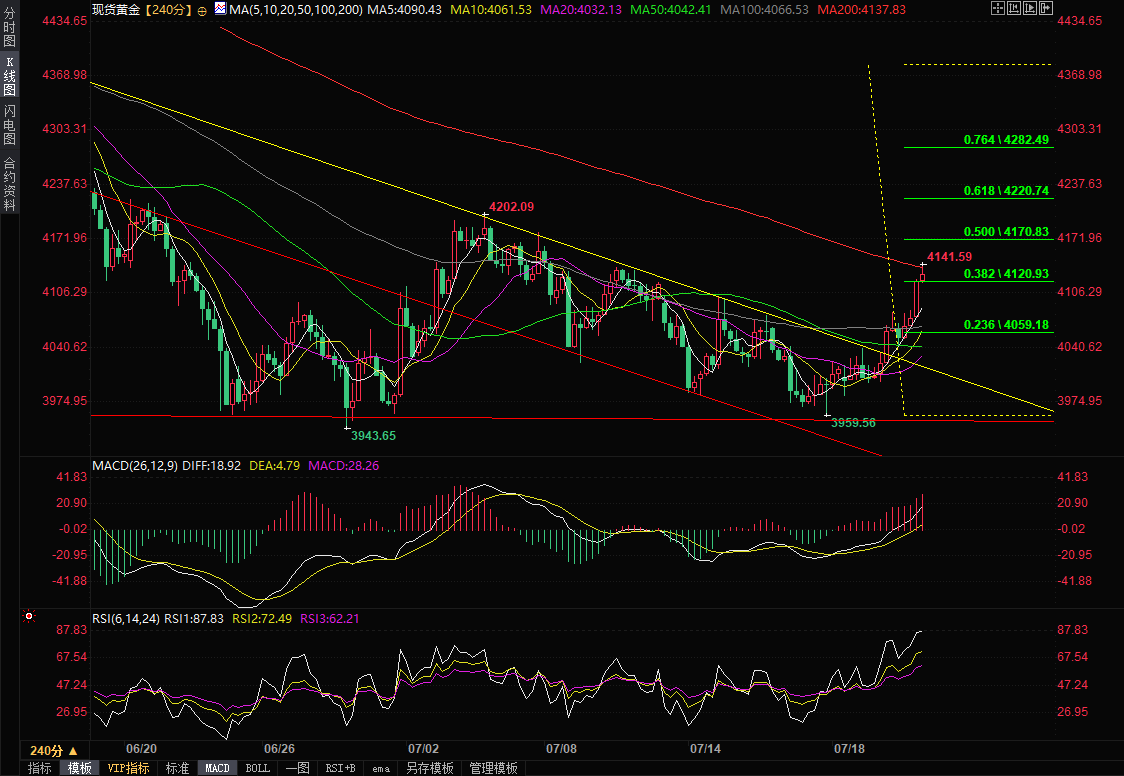 (Spot gold 4-hour chart, source: FX678)
Diplomatic engagement and military strikes proceed in tandem; the situation in the Middle East is gripping global attention.
Negotiation windows appear to be opening, while military pressure escalates simultaneously. US Secretary of State Marco Rubio stated on Sunday that Washington remains open to talks with Tehran, a signal initially interpreted by the market as a glimmer of hope for de-escalation. Meanwhile, Iranian Interior Minister Eskandar Mhomeini visited Pakistan, the mediator, requesting Islamabad to continue its mediation role, suggesting diplomatic channels were not entirely closed. However, beneath this facade of peace, the intensity of the military standoff has increased rather than decreased. The US military confirmed that it completed its 11th round of nighttime strikes against targets on Iranian territory on Wednesday morning, focusing on destroying aircraft hangars and drone storage facilities. Iran, in turn, has intensified its attacks on US assets in the Gulf region, expanding its targets to military outposts in Bahrain, Kuwait, and Jordan. Adding to the tension in the energy market, Iranian forces attacked two oil tankers attempting to pass through the Strait of Hormuz, while the Houthi rebels in Yemen announced a naval blockade of Saudi Arabia, indicating a multi-point spread of the conflict.Energy inflation looms large, and expectations for a Federal Reserve rate hike are rising.
Oil prices surged to a monthly high, and the probability of an interest rate hike climbed to 88%. The risk of congestion in the Strait of Hormuz, a global energy chokepoint, directly pushed crude oil prices to their highest level since June 12. Soaring energy costs are reigniting market anxieties about imported inflation, potentially forcing the Federal Reserve to maintain its hawkish monetary policy stance amid renewed price pressures. The CME Group's FedWatch tool shows traders expect an 88% probability of at least one more rate hike by the end of the year. This expectation has significantly boosted US Treasury yields and increased the cost of holding gold, a non-interest-bearing asset, thus limiting the upside potential of gold prices. Analysts at OCBC Bank point out that in the current macroeconomic environment, gold is more likely to exhibit a "two-way oscillation" pattern, with any rebound encountering stubborn resistance. They believe that for gold to achieve a more sustainable recovery, three prerequisites need to be met: a significant decline in oil prices, a moderate decrease in real yields, and a cooling of expectations for Fed tightening. Until these conditions are met, the upside potential of gold prices will remain constrained.Technical Analysis: The $4,100 level becomes a short-term dividing line between bullish and bearish sentiment.
Gold Technical Analysis: 200-Period Moving Average Presents a Key Test From the 4-hour chart, if gold prices can effectively break through the 38.2% Fibonacci retracement level of the downtrend since mid-June (corresponding to the psychological level of $4120), the short-term bullish signal will be further strengthened. Current momentum indicators are robust, with the 14-day Relative Strength Index (RSI) rising to around 72, approaching overbought territory; the Moving Average Convergence Divergence (MACD) remains above the zero line in positive territory, indicating that buying momentum has not yet weakened. However, bulls need to remain cautious, as a more sustainable upward structure requires gold prices to consistently close above the 200-period simple moving average (SMA, currently around $4138) on the 4-hour chart. On the upside target, if gold prices successfully break through the 200-period SMA resistance, the next target will be the 50.0% Fibonacci retracement level ($4170), and then challenge the 61.8% Fibonacci retracement level ($4220). On a larger timeframe, the 78.6% Fibonacci retracement level ($4282) and the previous cycle high of $4382 constitute the final target area for the medium-term bulls. On the downside, recent support levels are successively the $4100 level, the 38.2% retracement level ($4120), and the 23.6% Fibonacci retracement level ($4059). If these support levels are breached, gold prices may retest the $4000 support level, or even accelerate their decline towards the structural low near $3943. (Spot gold 4-hour chart, source: FX678)Editor's Summary
The current gold market is caught in a dual game of geopolitical risk premium and expectations of monetary policy tightening. Technical buying on dips is providing support for gold prices, but the unpredictable nature of the US-Iran negotiations makes energy prices more likely to rise than fall. This not only exacerbates global inflation concerns but also solidifies market expectations that the Federal Reserve will maintain high interest rates, thus putting downward pressure on gold prices. Technically, although gold prices have broken through key Fibonacci support, they face the dual test of the 200-period moving average and overbought territory. In the short term, gold's movement will be highly dependent on the development of the Middle East situation and US inflation data; whether the $4100 level is breached will be a key reference for judging the next stage of the trend. As of 13:57 Beijing time, spot gold is trading at $4128.85 per ounce.- Risk Warning and Disclaimer
- The market involves risk, and trading may not be suitable for all investors. This article is for reference only and does not constitute personal investment advice, nor does it take into account certain users’ specific investment objectives, financial situation, or other needs. Any investment decisions made based on this information are at your own risk.