Dollar Analysis: Fed Hawkish Expectations Repriced, Benefiting Dollar Bulls
2026-07-22 17:50:14
The simultaneous emergence of a bullish market environment, driven by macroeconomic fundamentals, interest rate trends, and technical factors, is rare indeed. This favorable situation is particularly pronounced ahead of next week's Federal Open Market Committee (FOMC) meeting. A continued hawkish shift in Fed policy expectations is pushing up short-term Treasury yields; safe-haven buying is further supporting the dollar's rise; and the lack of major US economic data this week makes it unlikely to reverse the dollar's bullish trend.  The US dollar index recently broke out, primarily driven by the market's significant upward adjustment of its pricing for a hawkish stance from the Federal Reserve ahead of the FOMC meeting. Escalating geopolitical conflicts in the Middle East, pushing up energy prices, provided a strong fundamental boost, further solidifying the dollar's bullish technical outlook. Data confirms this breakout . Correlation matrix data corroborates this assessment. Over the past five trading days, the US dollar index has shown a near-perfect positive correlation with the market's priced-in expectation of the one-year Federal Reserve policy rate (correlation coefficient 0.99), reflecting a continued market repricing and expectation that the federal funds rate will remain on a tight path. Looking at the entire US Treasury yield curve, the correlation coefficients between the US dollar index and the yields of 2-year and 10-year US Treasury bonds reached 0.86 and 0.89, respectively. Observing the correlation from another perspective, the conclusion remains the same. During the same period, the US dollar index and US 2-year Treasury futures showed a near-perfect negative correlation (correlation coefficient -0.99), the underlying logic of which is quite straightforward: falling Treasury futures prices correspond to rising yields. Geopolitical tensions further fuel the dollar's rise. Various signs indicate that the US dollar is once again attracting safe-haven funds. The MOVE index, which measures implied volatility in the US Treasury market, shows a strengthening positive correlation with the dollar index; global sovereign bond market volatility is generally rising, and market uncertainty is increasing, continuously boosting demand for the dollar. Multiple factors underlie this safe-haven buying: the new British Prime Minister's consistent advocacy of expansionary fiscal policies has reignited market concerns about the UK's fiscal prospects, causing significant volatility in UK government bonds. Meanwhile, the ongoing conflict in the Middle East and rising energy prices exacerbate the downside risks to major energy-importing countries such as Europe and Japan, indirectly benefiting the dollar. Technical Analysis: Dollar Bulls Regain Control While the dollar index cannot be directly traded, it directly reflects the overall direction and risk of the dollar's rise and fall.
 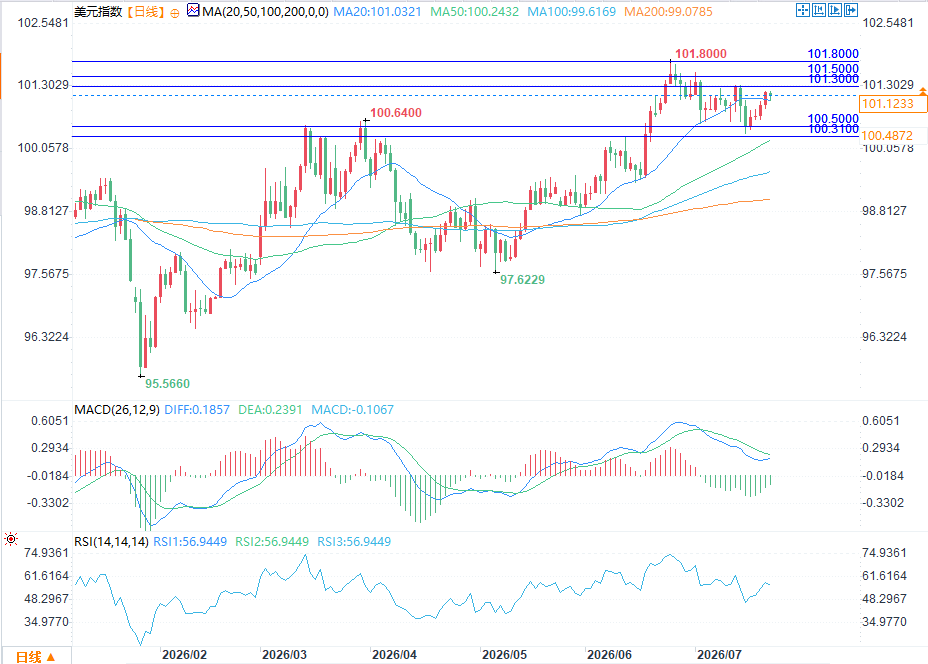 (US Dollar Index Daily Chart Source: FX678) After last week's US CPI and PPI inflation data fell short of expectations, the US Dollar Index briefly broke below the upward channel that began in early May. However, the market has improved significantly in the last four trading days: the daily chart first showed a piercing bullish signal, followed by continuous buying, and the price finally broke through the downward trend line that started from the high on June 24. The medium- to long-term trend signals remain bullish. The US Dollar Index has consistently held above the 50-day, 100-day, and 200-day moving averages, and all moving averages are maintaining an upward trend. The 14-day Relative Strength Index (RSI), which had been declining since the end of June, has also broken through its downward channel. Currently, the RSI reading is around 58, which has not yet reached a new high for the period, but the momentum has begun to tilt towards the bulls. The MACD indicator remains positive, and the two lines continue to converge, suggesting that a bullish golden cross may be imminent. If buying pressure continues, the primary upside target is 101.30, a level where prices have encountered resistance multiple times this month. A break above this level would target 101.50 and then the June 24 high of 101.80. A sustained hold above this level would target the May 2025 high of 102.00. On the downside, if a pullback occurs, the previously broken downtrend line will become the first level to watch; observe whether resistance can turn into support. Additionally, significant buying pressure emerged below 100.50 last week; a more crucial support level lies at 100.31, which was a significant resistance level on June 11. The movement of US Treasury futures corroborates this market logic . Correlation data already shows a high degree of linkage between the US dollar index and the 2-year US Treasury yield. Observing the movement of Treasury futures provides another dimension to verify the current market logic. Since futures prices and yields move inversely, the continued weakness of 2-year US Treasury futures indicates that the market continues to bet on a hawkish stance from the Federal Reserve. The overall trend for 2-year US Treasury futures is clearly bearish. Over the past six weeks, prices have consistently hit lower highs and lower lows, indicating a continued rise in short-term US Treasury yields. After last week's inflation data cooled, futures prices rebounded briefly, but encountered selling pressure after reaching the resistance zone where the 50-day moving average and the downward trend line intersect. Bears have regained control of the market, and previous lows have returned to the market's attention. A break below this low would further confirm the downtrend, with key support at 102.16. This level is significant: from late 2024 to early 2025, whenever prices tested or even briefly broke below this level, they were met with substantial buying. Whether this level can attract buying support again will directly determine the subsequent direction of short-term US Treasury yields; if support is breached, it will further support the overall logic of a stronger dollar. What factors might end the dollar's bullish run? In the short term, there are no clear signs of a reversal in the existing bullish driving forces. No major US economic data is scheduled for release this week, making it unlikely to change the current fundamental and technical landscape. With the Federal Reserve entering its pre-meeting quiet period, there is a lack of significant catalysts in the US before next week's policy decision. Market volatility is likely stemming from external risks: if the situation in the Middle East eases significantly and energy price pressures subside, the upward momentum of the US dollar will weaken. On the other hand, the USD/JPY exchange rate has already reached multi-decade highs; if the yen depreciates further rapidly, the risk of intervention in the foreign exchange market by the Japanese Ministry of Finance should not be underestimated. Prior to this, the pricing of hawkish expectations from the Federal Reserve, rising short-term US Treasury yields, and a generally favorable technical pattern suggest that an upward trend for the US dollar remains the path of least resistance.
The US dollar index recently broke out, primarily driven by the market's significant upward adjustment of its pricing for a hawkish stance from the Federal Reserve ahead of the FOMC meeting. Escalating geopolitical conflicts in the Middle East, pushing up energy prices, provided a strong fundamental boost, further solidifying the dollar's bullish technical outlook. Data confirms this breakout . Correlation matrix data corroborates this assessment. Over the past five trading days, the US dollar index has shown a near-perfect positive correlation with the market's priced-in expectation of the one-year Federal Reserve policy rate (correlation coefficient 0.99), reflecting a continued market repricing and expectation that the federal funds rate will remain on a tight path. Looking at the entire US Treasury yield curve, the correlation coefficients between the US dollar index and the yields of 2-year and 10-year US Treasury bonds reached 0.86 and 0.89, respectively. Observing the correlation from another perspective, the conclusion remains the same. During the same period, the US dollar index and US 2-year Treasury futures showed a near-perfect negative correlation (correlation coefficient -0.99), the underlying logic of which is quite straightforward: falling Treasury futures prices correspond to rising yields. Geopolitical tensions further fuel the dollar's rise. Various signs indicate that the US dollar is once again attracting safe-haven funds. The MOVE index, which measures implied volatility in the US Treasury market, shows a strengthening positive correlation with the dollar index; global sovereign bond market volatility is generally rising, and market uncertainty is increasing, continuously boosting demand for the dollar. Multiple factors underlie this safe-haven buying: the new British Prime Minister's consistent advocacy of expansionary fiscal policies has reignited market concerns about the UK's fiscal prospects, causing significant volatility in UK government bonds. Meanwhile, the ongoing conflict in the Middle East and rising energy prices exacerbate the downside risks to major energy-importing countries such as Europe and Japan, indirectly benefiting the dollar. Technical Analysis: Dollar Bulls Regain Control While the dollar index cannot be directly traded, it directly reflects the overall direction and risk of the dollar's rise and fall. (US Dollar Index Daily Chart Source: FX678) After last week's US CPI and PPI inflation data fell short of expectations, the US Dollar Index briefly broke below the upward channel that began in early May. However, the market has improved significantly in the last four trading days: the daily chart first showed a piercing bullish signal, followed by continuous buying, and the price finally broke through the downward trend line that started from the high on June 24. The medium- to long-term trend signals remain bullish. The US Dollar Index has consistently held above the 50-day, 100-day, and 200-day moving averages, and all moving averages are maintaining an upward trend. The 14-day Relative Strength Index (RSI), which had been declining since the end of June, has also broken through its downward channel. Currently, the RSI reading is around 58, which has not yet reached a new high for the period, but the momentum has begun to tilt towards the bulls. The MACD indicator remains positive, and the two lines continue to converge, suggesting that a bullish golden cross may be imminent. If buying pressure continues, the primary upside target is 101.30, a level where prices have encountered resistance multiple times this month. A break above this level would target 101.50 and then the June 24 high of 101.80. A sustained hold above this level would target the May 2025 high of 102.00. On the downside, if a pullback occurs, the previously broken downtrend line will become the first level to watch; observe whether resistance can turn into support. Additionally, significant buying pressure emerged below 100.50 last week; a more crucial support level lies at 100.31, which was a significant resistance level on June 11. The movement of US Treasury futures corroborates this market logic . Correlation data already shows a high degree of linkage between the US dollar index and the 2-year US Treasury yield. Observing the movement of Treasury futures provides another dimension to verify the current market logic. Since futures prices and yields move inversely, the continued weakness of 2-year US Treasury futures indicates that the market continues to bet on a hawkish stance from the Federal Reserve. The overall trend for 2-year US Treasury futures is clearly bearish. Over the past six weeks, prices have consistently hit lower highs and lower lows, indicating a continued rise in short-term US Treasury yields. After last week's inflation data cooled, futures prices rebounded briefly, but encountered selling pressure after reaching the resistance zone where the 50-day moving average and the downward trend line intersect. Bears have regained control of the market, and previous lows have returned to the market's attention. A break below this low would further confirm the downtrend, with key support at 102.16. This level is significant: from late 2024 to early 2025, whenever prices tested or even briefly broke below this level, they were met with substantial buying. Whether this level can attract buying support again will directly determine the subsequent direction of short-term US Treasury yields; if support is breached, it will further support the overall logic of a stronger dollar. What factors might end the dollar's bullish run? In the short term, there are no clear signs of a reversal in the existing bullish driving forces. No major US economic data is scheduled for release this week, making it unlikely to change the current fundamental and technical landscape. With the Federal Reserve entering its pre-meeting quiet period, there is a lack of significant catalysts in the US before next week's policy decision. Market volatility is likely stemming from external risks: if the situation in the Middle East eases significantly and energy price pressures subside, the upward momentum of the US dollar will weaken. On the other hand, the USD/JPY exchange rate has already reached multi-decade highs; if the yen depreciates further rapidly, the risk of intervention in the foreign exchange market by the Japanese Ministry of Finance should not be underestimated. Prior to this, the pricing of hawkish expectations from the Federal Reserve, rising short-term US Treasury yields, and a generally favorable technical pattern suggest that an upward trend for the US dollar remains the path of least resistance.
- Risk Warning and Disclaimer
- The market involves risk, and trading may not be suitable for all investors. This article is for reference only and does not constitute personal investment advice, nor does it take into account certain users’ specific investment objectives, financial situation, or other needs. Any investment decisions made based on this information are at your own risk.