The continued pressure on gold prices from the US dollar and US Treasury yields has sparked a wave of gold resource self-sufficiency efforts in several Asian countries.
2026-10-05 10:30:17
Gold prices were pressured by a stronger dollar and high US interest rates, but continued buying suggests that bears have not yet fully gained control of the market. The decline in gold prices from recent highs has slowed, encountering resistance at $4100. Spot gold fell 3.40% last week, closing at $4140.31 per ounce on Friday, a daily drop of 0.88%, while the overall decline for September reached 6.55%.
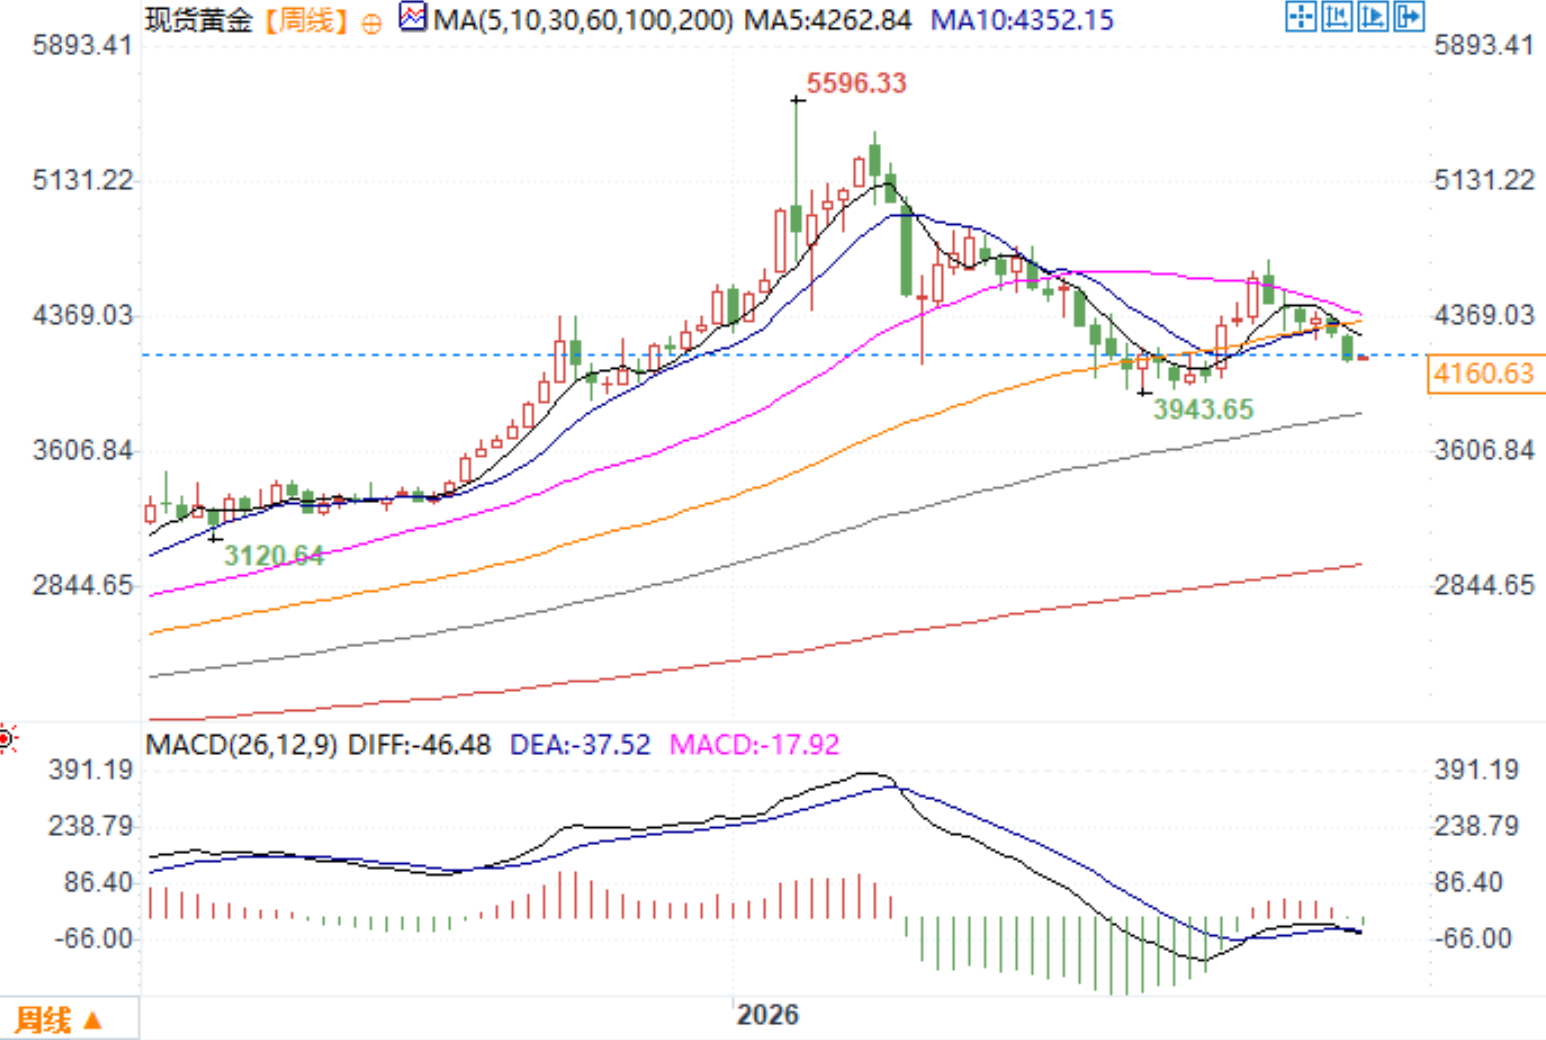 Spot gold weekly chart source: FX678. At 10:25 AM Beijing time on October 5th, spot gold was trading at $4160.63 per ounce.
The US dollar and US Treasury yields are the main resistance levels.
Gold is a non-interest-bearing asset, and a strong US dollar and high US Treasury yields have consistently been the two core factors suppressing gold prices. Last week, the US dollar index rose by about 1%, and the 10-year US Treasury yield once broke through 5.25%. Although the dollar and US Treasury yields fell slightly on Friday, gold did not receive a significant boost, and even with weak employment data, investors remained cautious overall. Gold prices surged to around $4,700 on August 25, before a sharp reversal, falling all the way to the $4,100 range. However, the bears have found it difficult to continue their decline below $4,000, repeatedly finding support from buyers, indicating that the bulls have not yet exited the market during this overall correction. If gold prices effectively break below $4,000, it will open up further downside potential; if gold prices continue to consolidate above the support level, they may accumulate strength and attempt another rebound. The latest US non-farm payroll data shows that only 29,000 jobs were added in September, and wage growth slowed to 3.0% year-on-year. Weak employment data should theoretically ease pressure on the Federal Reserve to raise interest rates and increase gold's attractiveness relative to interest-bearing assets. However, gold prices ultimately closed lower, demonstrating the strong downward pressure from the dollar and the bond market. For gold prices to stage a strong rebound, both the dollar and real yields need to decline in tandem.Asia promotes localization of gold resources
With gold prices at historical highs, many Asian countries are exploring the value of domestic gold production and promoting self-sufficiency in gold resources. Indonesia plans to impose an export tax on primary and semi-finished gold, with the tax rate set between 7.5% and 15% based on international gold prices. The policy aims to encourage gold to be refined and processed domestically. South Korea has restarted its physical gold purchase program, collaborating with local refining companies to purchase gold that would otherwise be exported, thereby increasing domestic reserves and reducing dependence on the international gold market. Major Asian countries continue to increase their official gold reserves, viewing gold as a strategic resource and continuously improving the management of their domestic gold supply chains. Singapore and Hong Kong are also expanding regional gold infrastructure. Singapore has established a central bank gold storage system, and Hong Kong has launched a local gold clearing pilot program. These measures will benefit physical gold demand in the long term and enhance the region's self-sufficiency in gold supply.Gold Technical Outlook
After a strong surge in August, gold prices encountered resistance and retreated near $4,700, a signal that warrants attention. As long as gold prices remain above $4,000, the long-term bullish structure can be maintained, and a new support zone has formed below $4,300. Currently, the gold market is in a stalemate between bulls and bears. On one hand, there is stable demand for gold from major Asian countries and safe-haven flows providing support; on the other hand, high oil prices, a strong dollar, and the continued risk of further tightening of monetary policy by the Federal Reserve continue to exert downward pressure. Before the pressure from monetary policy eases, it will be difficult for gold prices to retest $4,700.Conclusion
In summary, as long as the US dollar and US Treasury yields remain high, gold prices will still face downside risks, but the buying power above the $4,000 level cannot be ignored. If gold prices hold this level, the market is expected to stabilize and begin a rebound; however, if they break below this level, the technical pattern will be damaged, and the risk of a new round of rapid decline will increase. Spot gold weekly chart source: FX678. At 10:25 AM Beijing time on October 5th, spot gold was trading at $4160.63 per ounce.
- Risk Warning and Disclaimer
- The market involves risk, and trading may not be suitable for all investors. This article is for reference only and does not constitute personal investment advice, nor does it take into account certain users’ specific investment objectives, financial situation, or other needs. Any investment decisions made based on this information are at your own risk.