US Treasury yields fell slightly, while gold fluctuated around 4150.
2026-10-07 08:56:18
On Wednesday during Asian trading hours, spot gold continued its consolidation, trading around $4,160 per ounce , after rising approximately 0.6% to close at $4,164 in the previous session. The direct driver of this rebound was the simultaneous cooling of the bond and energy markets: the yield on the 10-year US Treasury note fell more than 2 basis points from its intraday high since April 2002 to approximately 5.286% , the 30-year yield retreated to 5.661% after breaking through levels not seen since May 2002, and the policy-sensitive 2-year yield also fell more than 3 basis points to 4.798% ; meanwhile, international oil prices fell below the $100 per barrel mark. Previously, safe-haven buying triggered by turmoil in the European bond market and concerns about tightening due to high US Treasury yields had jointly suppressed the valuation space of precious metals. Now, with these two pressures easing simultaneously, the logic behind gold's rebound is established.  The backdrop to this round of market movements is not simple. Over the past few weeks, the global bond market has experienced an unprecedented sell-off: long-term US Treasury yields have continued to climb due to a combination of factors, including expanding fiscal deficits, a resilient economy, and rising inflation expectations. The 10-year yield once touched a more than 20-year high of around 5.35%, and some institutions even warned that the 30-year yield "may break through 6% this month." The rise in yields has significantly increased the holding costs of non-interest-bearing assets, and gold had previously fallen below the $4,100 mark, hitting a two-month low. Now, with yields retreating from their highs and falling oil prices easing concerns about the transmission of energy costs to core inflation, market expectations for further Fed rate hikes have cooled significantly . According to the CME FedWatch Tool, the market expects a 79.5% probability of the Fed holding rates steady in October , and the probability of a 25 basis point rate hike has dropped to around 20.5%, while just a week ago, the market was pricing in a nearly 70% chance of an October rate hike. The minutes of the Federal Open Market Committee (FOMC) meeting will be released later on Wednesday , becoming the most crucial macroeconomic event of the day. These minutes correspond to the interest rate decision last month (September 16th)—when the Fed raised interest rates by 25 basis points to a range of 3.75%-4.00%, the first rate hike in three years , with all 12 voting members voting in favor. The wording in the minutes regarding the persistence of inflation, the impact of energy prices, and the future policy path will directly influence the market's judgment on the December meeting and even the policy pace next year, thus determining whether this round of gold price rebound is a "correction after overselling" or a "trend reversal." Looking at the behavior of market participants, sentiment is subtly improving. Commerzbank points out that gold prices are "temporarily stabilizing around $4150 per ounce," reflecting a slight easing of market concerns about the rapid rise in US interest rates ; at the same time, while exchange-traded fund (ETF) investors have not significantly increased their holdings recently, they have also stopped reducing them, and the stabilization of positions provides support for prices. Metals Focus's annual outlook suggests that gold prices could reach a new all-time high in 2027 , based on a rebound in medium-term investor interest. This medium- to long-term assessment contrasts with short-term caution, indicating that the sustainability of this rally still depends on substantial changes in the interest rate environment. However, disagreements on monetary policy persist. The Federal Reserve's stance on inflation remains hawkish: Kansas City Fed President Schmid recently emphasized that the labor market "remains in good shape," while warning that artificial intelligence (AI) investment has become one of the main drivers of current inflation. He also believes that even with higher long-term yields, there is still work to be done on short-term interest rates, and the Fed's credibility requires it to prioritize price stability. The FXS Hawkish Index, which measures the Fed's communication tone, has risen to 137.91, still significantly above the neutral level of 100—meaning that the Fed's overall communication remains restrictive , and if future data supports this, the window for rate hikes is not completely closed. For gold, near-term support comes from cooling rate hike expectations and safe-haven demand, while long-term pressure comes from potential upward pressure on interest rates. The interplay of bullish and bearish factors means that current prices remain range-bound. From a technical perspective, gold prices are still trading below the 100-day moving average and the Bollinger Band middle line on the daily chart, maintaining a bearish short-term structure. However, it's worth noting that the 14-day Relative Strength Index (RSI) is around 40.69 , indicating that downward momentum is not strong, reflecting more of a consolidation phase than a trend collapse. On the upside resistance level, the $4265-$4270 area forms the first resistance zone, where the Bollinger Band middle line and the 100-day moving average converge. A rebound to this level is likely to encounter selling pressure; a break above this level would target the upper Bollinger Band around $4440. On the downside support level, the lower Bollinger Band around $4090 is a key short-term support level ; a decisive break below this level would open up further downside potential on the daily chart. $4150 serves as psychological support for the recent stabilization platform. From a 4-hour chart perspective, gold prices have formed a short-term stabilization structure above $4160. The MACD histogram is converging from a low level, and short-term moving averages are beginning to flatten, indicating that the recovery after the oversold condition is still ongoing. However, the rebound momentum is limited, and the indicators have not yet formed a clear golden cross confirmation. The key to the future direction is: if gold prices can hold above $4150 and challenge the $4265-$4270 resistance zone, then the 4-hour rebound can be confirmed to have upgraded; conversely, if the rebound is weak and falls below $4150, it is highly likely to fall back to test the $4090 level.
 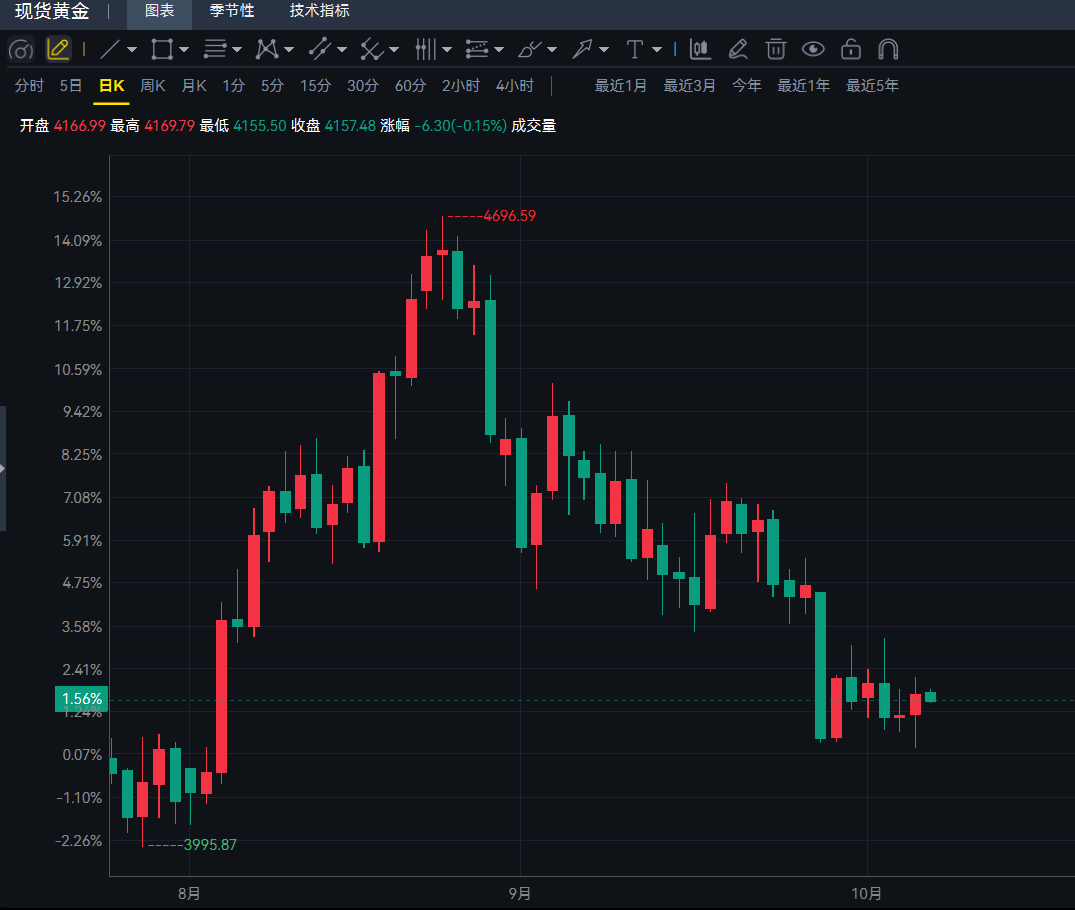 Editor's Summary : Overall, gold is currently in a recovery phase characterized by "easing negative factors and lingering positive factors": the decline in US Treasury yields from their highs and the cooling of interest rate hike expectations have provided breathing room for gold prices, while reduced ETF selling pressure and safe-haven demand have solidified support levels. However, the fundamental macroeconomic backdrop of high interest rates has not fundamentally changed, and the Fed's hawkish communication and the risk of a December rate hike still constrain upward movement. Gold prices are more likely to digest these contradictions through range-bound trading rather than a unilateral breakout. Looking ahead, the short-term direction depends on the wording of tonight's FOMC minutes and the subsequent release of US inflation data—if the minutes signal patience regarding rate hikes and concern about downside economic risks, gold prices are expected to challenge the $4265-$4270 resistance zone; conversely, if the minutes emphasize sticky inflation and the energy shock, gold prices may fall back to test the $4090 support level.
The backdrop to this round of market movements is not simple. Over the past few weeks, the global bond market has experienced an unprecedented sell-off: long-term US Treasury yields have continued to climb due to a combination of factors, including expanding fiscal deficits, a resilient economy, and rising inflation expectations. The 10-year yield once touched a more than 20-year high of around 5.35%, and some institutions even warned that the 30-year yield "may break through 6% this month." The rise in yields has significantly increased the holding costs of non-interest-bearing assets, and gold had previously fallen below the $4,100 mark, hitting a two-month low. Now, with yields retreating from their highs and falling oil prices easing concerns about the transmission of energy costs to core inflation, market expectations for further Fed rate hikes have cooled significantly . According to the CME FedWatch Tool, the market expects a 79.5% probability of the Fed holding rates steady in October , and the probability of a 25 basis point rate hike has dropped to around 20.5%, while just a week ago, the market was pricing in a nearly 70% chance of an October rate hike. The minutes of the Federal Open Market Committee (FOMC) meeting will be released later on Wednesday , becoming the most crucial macroeconomic event of the day. These minutes correspond to the interest rate decision last month (September 16th)—when the Fed raised interest rates by 25 basis points to a range of 3.75%-4.00%, the first rate hike in three years , with all 12 voting members voting in favor. The wording in the minutes regarding the persistence of inflation, the impact of energy prices, and the future policy path will directly influence the market's judgment on the December meeting and even the policy pace next year, thus determining whether this round of gold price rebound is a "correction after overselling" or a "trend reversal." Looking at the behavior of market participants, sentiment is subtly improving. Commerzbank points out that gold prices are "temporarily stabilizing around $4150 per ounce," reflecting a slight easing of market concerns about the rapid rise in US interest rates ; at the same time, while exchange-traded fund (ETF) investors have not significantly increased their holdings recently, they have also stopped reducing them, and the stabilization of positions provides support for prices. Metals Focus's annual outlook suggests that gold prices could reach a new all-time high in 2027 , based on a rebound in medium-term investor interest. This medium- to long-term assessment contrasts with short-term caution, indicating that the sustainability of this rally still depends on substantial changes in the interest rate environment. However, disagreements on monetary policy persist. The Federal Reserve's stance on inflation remains hawkish: Kansas City Fed President Schmid recently emphasized that the labor market "remains in good shape," while warning that artificial intelligence (AI) investment has become one of the main drivers of current inflation. He also believes that even with higher long-term yields, there is still work to be done on short-term interest rates, and the Fed's credibility requires it to prioritize price stability. The FXS Hawkish Index, which measures the Fed's communication tone, has risen to 137.91, still significantly above the neutral level of 100—meaning that the Fed's overall communication remains restrictive , and if future data supports this, the window for rate hikes is not completely closed. For gold, near-term support comes from cooling rate hike expectations and safe-haven demand, while long-term pressure comes from potential upward pressure on interest rates. The interplay of bullish and bearish factors means that current prices remain range-bound. From a technical perspective, gold prices are still trading below the 100-day moving average and the Bollinger Band middle line on the daily chart, maintaining a bearish short-term structure. However, it's worth noting that the 14-day Relative Strength Index (RSI) is around 40.69 , indicating that downward momentum is not strong, reflecting more of a consolidation phase than a trend collapse. On the upside resistance level, the $4265-$4270 area forms the first resistance zone, where the Bollinger Band middle line and the 100-day moving average converge. A rebound to this level is likely to encounter selling pressure; a break above this level would target the upper Bollinger Band around $4440. On the downside support level, the lower Bollinger Band around $4090 is a key short-term support level ; a decisive break below this level would open up further downside potential on the daily chart. $4150 serves as psychological support for the recent stabilization platform. From a 4-hour chart perspective, gold prices have formed a short-term stabilization structure above $4160. The MACD histogram is converging from a low level, and short-term moving averages are beginning to flatten, indicating that the recovery after the oversold condition is still ongoing. However, the rebound momentum is limited, and the indicators have not yet formed a clear golden cross confirmation. The key to the future direction is: if gold prices can hold above $4150 and challenge the $4265-$4270 resistance zone, then the 4-hour rebound can be confirmed to have upgraded; conversely, if the rebound is weak and falls below $4150, it is highly likely to fall back to test the $4090 level. Editor's Summary : Overall, gold is currently in a recovery phase characterized by "easing negative factors and lingering positive factors": the decline in US Treasury yields from their highs and the cooling of interest rate hike expectations have provided breathing room for gold prices, while reduced ETF selling pressure and safe-haven demand have solidified support levels. However, the fundamental macroeconomic backdrop of high interest rates has not fundamentally changed, and the Fed's hawkish communication and the risk of a December rate hike still constrain upward movement. Gold prices are more likely to digest these contradictions through range-bound trading rather than a unilateral breakout. Looking ahead, the short-term direction depends on the wording of tonight's FOMC minutes and the subsequent release of US inflation data—if the minutes signal patience regarding rate hikes and concern about downside economic risks, gold prices are expected to challenge the $4265-$4270 resistance zone; conversely, if the minutes emphasize sticky inflation and the energy shock, gold prices may fall back to test the $4090 support level.
- Risk Warning and Disclaimer
- The market involves risk, and trading may not be suitable for all investors. This article is for reference only and does not constitute personal investment advice, nor does it take into account certain users’ specific investment objectives, financial situation, or other needs. Any investment decisions made based on this information are at your own risk.