Further data shows a decline in Middle Eastern crude oil exports, contradicting Kpler's data.
2026-10-22 18:26:21
Yesterday, The Wall Street Journal, citing data from Kpler, reported that Middle Eastern oil exports rebounded to above pre-war levels in the week ending October 18, 2026. Data from the shipping tracking agency Kpler shows that total Middle Eastern oil traffic, including cargo through the Strait of Hormuz and other alternative shipping routes, averaged over 24 million barrels per day in the week ending October 18, compared to 23.3 million barrels per day before the war. In a report titled "Persian Gulf Oil Exports Now Exceed Pre-War Iranian Levels," The Wall Street Journal stated that preliminary estimates indicate that oil traffic through the Strait of Hormuz (including ship-to-ship transshipment in the Gulf of Oman) was approximately 14 million barrels per day during the same period, equivalent to 82% of pre-war levels. Pipelines between Saudi Arabia and the UAE also transport crude oil via other routes. Kpler estimates that about 40% of non-Iranian crude oil leaving the Persian Gulf in September bypassed the Strait of Hormuz, compared to only 17% before the war. In contrast, Iran's own crude oil exports remain restricted by the US naval blockade. Oil data shows that Middle Eastern crude oil and petroleum product exports have not increased. The Wall Street Journal's claim is problematic: other data sources besides Kpler show that Middle Eastern exports did not rise last week, but rather fell rapidly. 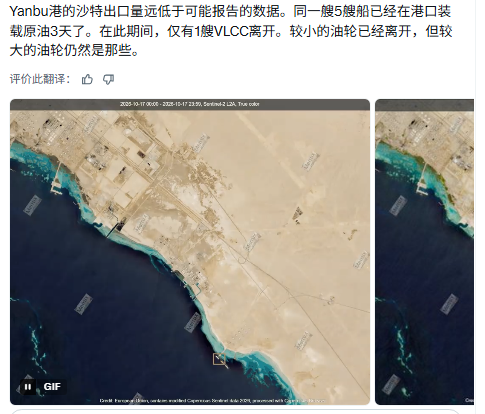 Satellite data up to October 17 shows that total crude oil and petroleum liquid exports from Yanbu port on Saudi Arabia's Red Sea coast remain low, contradicting claims of a significant increase in exports from Saudi Arabia's west coast. Furthermore, data from the crude oil tracking platform Lvision shows that in the week ending October 18, there was no substantial increase in Persian Gulf crude oil loadings or Strait of Hormuz transit volumes.
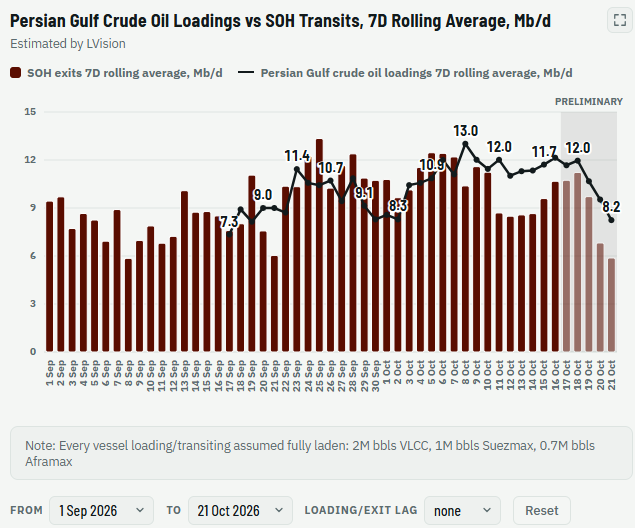 Figure 1: Crude oil loading volume through the Strait of Hormuz and crude oil transit volume through the Persian Gulf. The website hormuzstraittracker also shows that the export volume of crude oil and petroleum liquid fuels transported through the Strait of Hormuz is declining.
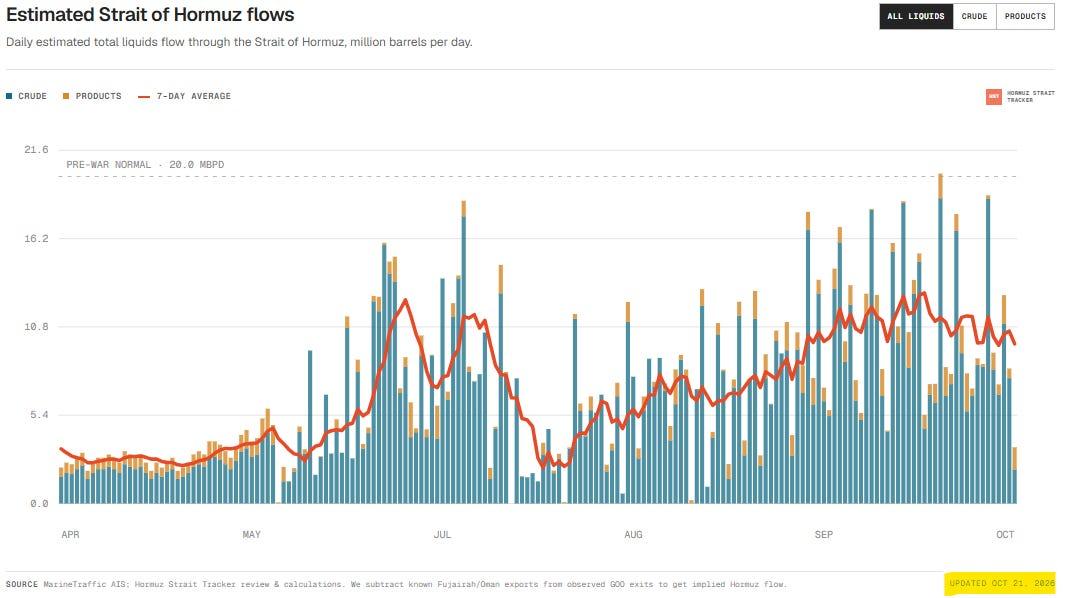 Figure 2: Daily oil tanker outbound traffic in the Strait of Hormuz as of October 21, 2026; Data source: [hormuzstraittracker.com](https://hormuzstraittracker.com)
 Lvision (Figure 1) estimates that, as of October 18, the 7-day average of crude oil exported via the Strait of Hormuz was 11.2 million barrels per day, higher than the estimate by hormuzstraittracker. During the same period, an additional 3.5 million barrels per day of crude oil was estimated to be exported through ports in the Gulf of Oman, mainly from the Fujairah storage and transportation base in the UAE and various ports in Oman. Using Lvision's higher estimate, the average export value for the above routes was 14.7 million barrels per day for the week ending October 18. Combined with the previously mentioned low loading volumes at Yanbu Port on the Saudi Red Sea, Kpler's conclusion that "Middle East exports reached 24 million barrels per day for the week ending October 18" is unrealistic. After deducting local consumption, the estimated amount of crude oil available for export from wellhead production in the Middle East is only about 13 million barrels per day, which is also the sustainable upper limit for crude oil exports from the Middle East—far lower than the export data given by the Wall Street Journal and Kpler for the previous week. We will continue to monitor subsequent data to verify whether Kpler's conclusions hold true. The world is heading towards a sharp rise in energy prices and shortages of fuel and fertilizers. This will further push up inflation, trigger food shortages, and force interest rates upward, ultimately bursting the global stock, bond, and other asset bubbles that central banks have maintained for 40 years.
Satellite data up to October 17 shows that total crude oil and petroleum liquid exports from Yanbu port on Saudi Arabia's Red Sea coast remain low, contradicting claims of a significant increase in exports from Saudi Arabia's west coast. Furthermore, data from the crude oil tracking platform Lvision shows that in the week ending October 18, there was no substantial increase in Persian Gulf crude oil loadings or Strait of Hormuz transit volumes. Figure 1: Crude oil loading volume through the Strait of Hormuz and crude oil transit volume through the Persian Gulf. The website hormuzstraittracker also shows that the export volume of crude oil and petroleum liquid fuels transported through the Strait of Hormuz is declining. Figure 2: Daily oil tanker outbound traffic in the Strait of Hormuz as of October 21, 2026; Data source: [hormuzstraittracker.com](https://hormuzstraittracker.com) Lvision (Figure 1) estimates that, as of October 18, the 7-day average of crude oil exported via the Strait of Hormuz was 11.2 million barrels per day, higher than the estimate by hormuzstraittracker. During the same period, an additional 3.5 million barrels per day of crude oil was estimated to be exported through ports in the Gulf of Oman, mainly from the Fujairah storage and transportation base in the UAE and various ports in Oman. Using Lvision's higher estimate, the average export value for the above routes was 14.7 million barrels per day for the week ending October 18. Combined with the previously mentioned low loading volumes at Yanbu Port on the Saudi Red Sea, Kpler's conclusion that "Middle East exports reached 24 million barrels per day for the week ending October 18" is unrealistic. After deducting local consumption, the estimated amount of crude oil available for export from wellhead production in the Middle East is only about 13 million barrels per day, which is also the sustainable upper limit for crude oil exports from the Middle East—far lower than the export data given by the Wall Street Journal and Kpler for the previous week. We will continue to monitor subsequent data to verify whether Kpler's conclusions hold true. The world is heading towards a sharp rise in energy prices and shortages of fuel and fertilizers. This will further push up inflation, trigger food shortages, and force interest rates upward, ultimately bursting the global stock, bond, and other asset bubbles that central banks have maintained for 40 years.
- Risk Warning and Disclaimer
- The market involves risk, and trading may not be suitable for all investors. This article is for reference only and does not constitute personal investment advice, nor does it take into account certain users’ specific investment objectives, financial situation, or other needs. Any investment decisions made based on this information are at your own risk.