Following the Federal Reserve's interest rate decision, the US dollar index continued to fluctuate at high levels.
2026-10-29 14:24:23
On Thursday morning in Asia, the US dollar index traded in the 102.10-102.20 range, slightly lower than Wednesday's intraday high of 102.49, but still holding steady above 102.00. The key significance of this level lies in the fact that the Federal Reserve, at its October policy meeting on Wednesday, voted 10-2 to keep interest rates unchanged at 3.75%-4.00%, but the policy statement upgraded its economic assessment from "solid expansion" to "strong expansion," and removed the statement from the September meeting that "this action will support a more timely return of inflation to 2%," replacing it with "the accumulation of more information will help the Committee determine the appropriate policy stance." This change in wording was interpreted by the market as a "hawkish pause"—a pause does not equate to an end; the Fed is still waiting for data to confirm the inflation path.  From a policy signal perspective, the core contradiction lies in the interplay between "Wash's cautious wording" and "market pricing in interest rate hikes." Chairman Warsh refused to provide forward guidance at the press conference, emphasizing that "ensuring price stability is not about fixed dates on the calendar," and reiterated the inviolability of the 2% PCE target. However, he simultaneously announced adjustments to the FOMC meeting schedule starting in 2027, shifting some meetings to discussions on monetary policy strategies rather than interest rate votes. This move was interpreted by the market as a dovish signal, leading to a decline in the two-year Treasury yield and a short-term weakening of the dollar. However, the voting results themselves revealed internal divisions: Governor Cook and Cleveland Fed President Hammark voted against the proposal, advocating for an immediate 25 basis point rate hike. This combination of "hawkish dissenting votes + dovish institutional adjustments" has led to a divergence in market pricing of the year-end path—CME FedWatch shows a 78%-85% probability of a December rate hike, but expectations for further rate hikes in 2027 have been partially reduced. From a geopolitical risk perspective, the continued tension in the Middle East has provided additional safe-haven buying for the dollar. The Houthi rebels claimed responsibility for a ballistic missile attack on the Ras Tanura refinery in Saudi Arabia's eastern province (Saudi Arabia's largest oil refinery, with a processing capacity of 550,000 barrels per day). Trump threatened to resume military operations after the midterm elections, while Vice President Vance wrote to Rezaei, secretary of Iran's Supreme National Security Council, attempting to restart negotiations. This situation of "military deployment and diplomatic engagement in parallel" has created high uncertainty, leading to a preference for safe-haven funds to hold the US dollar. It is noteworthy that the impact of geopolitical risks on the US dollar is asymmetrical: it directly pushes up oil prices (WTI touched $103.50 intraday), thereby reinforcing inflation concerns and interest rate hike expectations, forming a transmission chain of "oil price → inflation → interest rate hike → US dollar"; simultaneously, safe-haven sentiment itself directly attracts capital inflows into US dollar assets. These two transmission chains, acting in tandem, constitute a significant support for the current strength of the US dollar. In a horizontal comparison, the current strength of the US dollar stems more from the "weaknesses of its adversaries" than from an absolute improvement in its own fundamentals. The euro is constrained by stagflation pressures as European natural gas prices have risen by more than a third this month, surpassing €90/MWh; the pound is under pressure ahead of the fiscal credibility test of the autumn budget; and the yen is passively weakening due to active carry trades. This divergence means that the dollar's rise is more likely to be "step-like" rather than "trend-like"—it will rise a step each time negative news about non-US currencies is priced in, then enter a period of consolidation until the next catalyst appears. This also explains why the dollar index has closed positive for three consecutive days, but the daily gains have always been limited. From the perspective of cross-asset correlation, the current fluctuations in the dollar index are essentially the superposition of four clues: first, the interest rate differential support formed by the high probability of a Fed rate hike at the end of the year; second, the safe-haven diversion caused by Middle East geopolitical risks and the transmission of oil prices; third, the structural changes in the US Treasury yield curve (short-end decline, long-end rise, and the curve steepening); and fourth, the passive appreciation brought about by the relative weakness of non-US currencies. Only when two or more of these clues resonate in the same direction can a trend breakout have a basis. On the 1-hour chart, the US dollar index is trading in the 102.10-102.20 range, with an overall neutral-to-bullish bias. The overnight pullback found support near the 100-period EMA and the 38.2% Fibonacci retracement level at 102.10, indicating potential buying interest on dips. The original chart analysis suggests that resistance levels to watch are the 23.6% Fibonacci retracement level around 102.25 (the primary resistance level in the near term), the cycle high anchor point around 102.49, and the horizontal resistance at 102.55 (a decisive break above this level would open up further upside potential). Support levels to watch are first the 38.2% Fibonacci retracement level around 102.09, followed by the 50.0% retracement level around 101.97 and the 61.8% retracement level around 101.85. A deeper pullback would test the structural support zone around the 78.6% retracement level around 101.67. On the daily chart, the index has rebounded from a three-week low and moved up along the short-term moving average. The RSI has moved away from the low level but is still in the neutral zone, indicating that the momentum is recovering but has not yet entered overbought territory, and there is still room for fluctuation.
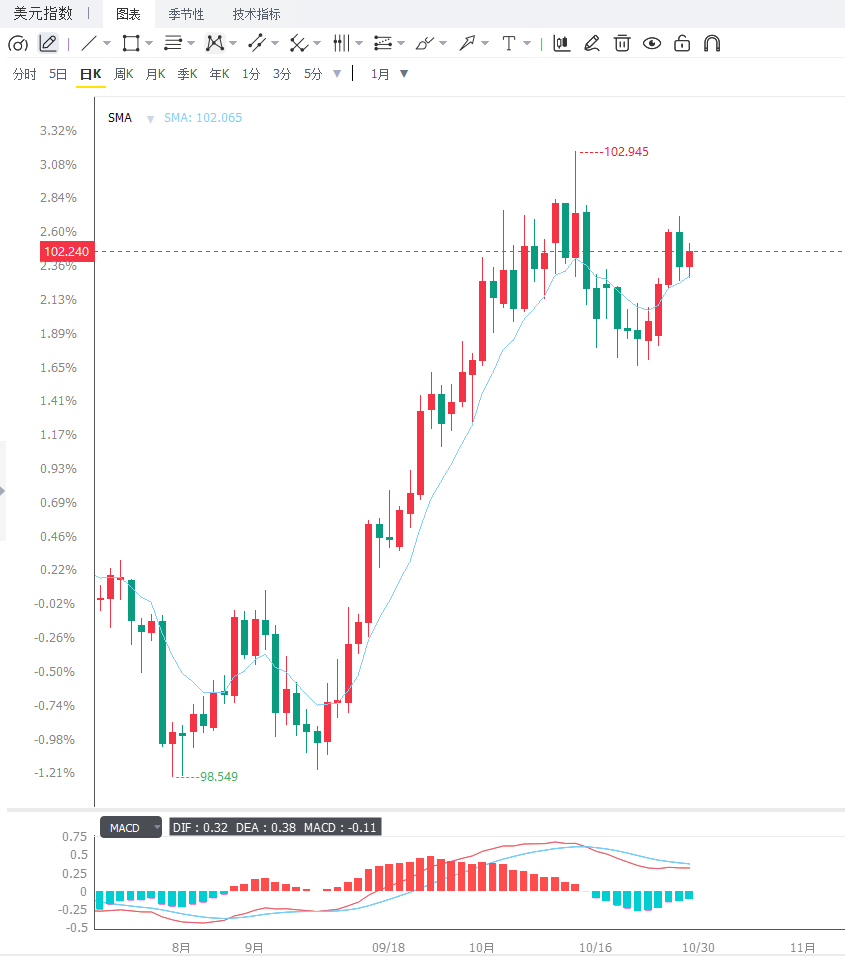 Editor's Summary: The core contradiction for the US dollar index in the short term lies in the support provided by the Fed's pause in hawkish stance and expectations of a year-end rate hike, while Warsh's rejection of forward guidance and the adjustment of the meeting schedule bring a dovish interpretation. This two-way driving force makes the index more likely to consolidate within the 102.00-102.55 range, awaiting a breakthrough in US data. Three variables need to be closely watched going forward: First, the upcoming release of the US Q3 GDP preliminary value and the September core PCE price index. The strength or weakness of these data will directly verify the rationality of the Fed's year-end rate hike path; stronger-than-expected data could push the index to test 102.55 or even 102.95. Second, the evolution of the Middle East geopolitical situation, especially the frequency of Houthi attacks on Saudi energy facilities and the progress of US-Iran negotiations, is the primary basis for judging whether safe-haven buying will continue. Third, whether the index can effectively break through the 102.55 resistance level is the primary technical basis for judging whether the bullish trend is accelerating.
From a policy signal perspective, the core contradiction lies in the interplay between "Wash's cautious wording" and "market pricing in interest rate hikes." Chairman Warsh refused to provide forward guidance at the press conference, emphasizing that "ensuring price stability is not about fixed dates on the calendar," and reiterated the inviolability of the 2% PCE target. However, he simultaneously announced adjustments to the FOMC meeting schedule starting in 2027, shifting some meetings to discussions on monetary policy strategies rather than interest rate votes. This move was interpreted by the market as a dovish signal, leading to a decline in the two-year Treasury yield and a short-term weakening of the dollar. However, the voting results themselves revealed internal divisions: Governor Cook and Cleveland Fed President Hammark voted against the proposal, advocating for an immediate 25 basis point rate hike. This combination of "hawkish dissenting votes + dovish institutional adjustments" has led to a divergence in market pricing of the year-end path—CME FedWatch shows a 78%-85% probability of a December rate hike, but expectations for further rate hikes in 2027 have been partially reduced. From a geopolitical risk perspective, the continued tension in the Middle East has provided additional safe-haven buying for the dollar. The Houthi rebels claimed responsibility for a ballistic missile attack on the Ras Tanura refinery in Saudi Arabia's eastern province (Saudi Arabia's largest oil refinery, with a processing capacity of 550,000 barrels per day). Trump threatened to resume military operations after the midterm elections, while Vice President Vance wrote to Rezaei, secretary of Iran's Supreme National Security Council, attempting to restart negotiations. This situation of "military deployment and diplomatic engagement in parallel" has created high uncertainty, leading to a preference for safe-haven funds to hold the US dollar. It is noteworthy that the impact of geopolitical risks on the US dollar is asymmetrical: it directly pushes up oil prices (WTI touched $103.50 intraday), thereby reinforcing inflation concerns and interest rate hike expectations, forming a transmission chain of "oil price → inflation → interest rate hike → US dollar"; simultaneously, safe-haven sentiment itself directly attracts capital inflows into US dollar assets. These two transmission chains, acting in tandem, constitute a significant support for the current strength of the US dollar. In a horizontal comparison, the current strength of the US dollar stems more from the "weaknesses of its adversaries" than from an absolute improvement in its own fundamentals. The euro is constrained by stagflation pressures as European natural gas prices have risen by more than a third this month, surpassing €90/MWh; the pound is under pressure ahead of the fiscal credibility test of the autumn budget; and the yen is passively weakening due to active carry trades. This divergence means that the dollar's rise is more likely to be "step-like" rather than "trend-like"—it will rise a step each time negative news about non-US currencies is priced in, then enter a period of consolidation until the next catalyst appears. This also explains why the dollar index has closed positive for three consecutive days, but the daily gains have always been limited. From the perspective of cross-asset correlation, the current fluctuations in the dollar index are essentially the superposition of four clues: first, the interest rate differential support formed by the high probability of a Fed rate hike at the end of the year; second, the safe-haven diversion caused by Middle East geopolitical risks and the transmission of oil prices; third, the structural changes in the US Treasury yield curve (short-end decline, long-end rise, and the curve steepening); and fourth, the passive appreciation brought about by the relative weakness of non-US currencies. Only when two or more of these clues resonate in the same direction can a trend breakout have a basis. On the 1-hour chart, the US dollar index is trading in the 102.10-102.20 range, with an overall neutral-to-bullish bias. The overnight pullback found support near the 100-period EMA and the 38.2% Fibonacci retracement level at 102.10, indicating potential buying interest on dips. The original chart analysis suggests that resistance levels to watch are the 23.6% Fibonacci retracement level around 102.25 (the primary resistance level in the near term), the cycle high anchor point around 102.49, and the horizontal resistance at 102.55 (a decisive break above this level would open up further upside potential). Support levels to watch are first the 38.2% Fibonacci retracement level around 102.09, followed by the 50.0% retracement level around 101.97 and the 61.8% retracement level around 101.85. A deeper pullback would test the structural support zone around the 78.6% retracement level around 101.67. On the daily chart, the index has rebounded from a three-week low and moved up along the short-term moving average. The RSI has moved away from the low level but is still in the neutral zone, indicating that the momentum is recovering but has not yet entered overbought territory, and there is still room for fluctuation. Editor's Summary: The core contradiction for the US dollar index in the short term lies in the support provided by the Fed's pause in hawkish stance and expectations of a year-end rate hike, while Warsh's rejection of forward guidance and the adjustment of the meeting schedule bring a dovish interpretation. This two-way driving force makes the index more likely to consolidate within the 102.00-102.55 range, awaiting a breakthrough in US data. Three variables need to be closely watched going forward: First, the upcoming release of the US Q3 GDP preliminary value and the September core PCE price index. The strength or weakness of these data will directly verify the rationality of the Fed's year-end rate hike path; stronger-than-expected data could push the index to test 102.55 or even 102.95. Second, the evolution of the Middle East geopolitical situation, especially the frequency of Houthi attacks on Saudi energy facilities and the progress of US-Iran negotiations, is the primary basis for judging whether safe-haven buying will continue. Third, whether the index can effectively break through the 102.55 resistance level is the primary technical basis for judging whether the bullish trend is accelerating.
- Risk Warning and Disclaimer
- The market involves risk, and trading may not be suitable for all investors. This article is for reference only and does not constitute personal investment advice, nor does it take into account certain users’ specific investment objectives, financial situation, or other needs. Any investment decisions made based on this information are at your own risk.