Gold ETFs attracted a record 222 tons of gold in the first quarter, with investment demand surging 47%; however, spot prices fell for four consecutive months. What are traders up to?
2025-10-30 22:01:16
On Thursday (October 30), spot gold underwent a mild recovery after four consecutive days of declines, finding support at the $3,900 level. However, bullish momentum remained weak, and gold prices failed to effectively recover the psychological barrier of $4,000, indicating that the short-term downtrend remains unchanged. During the North American session, spot gold traded around $3,980, with traders' expectations for a December rate cut by the Federal Reserve wavering, and rising US Treasury yields continuing to put pressure on gold prices.
Federal Reserve Chairman Jerome Powell's remarks following this week's policy meeting became a key trigger for the recent gold price correction. The Fed cut interest rates by 25 basis points as expected, lowering the target range for the federal funds rate to 3.75%-4.00%, marking the second consecutive 25-basis-point "risk-management" rate cut. However, Powell explicitly stated at the press conference that "further rate cuts at the December meeting are far from a certainty," a hawkish statement that quickly boosted the dollar index and US Treasury yields, putting downward pressure on gold, a non-interest-bearing asset.
In its statement, the Monetary Policy Committee acknowledged that economic activity continued to expand at a moderate pace, but job growth had slowed and inflation remained slightly elevated. Policymakers considered the economic outlook to be highly uncertain, with downside risks to the labor market having increased in recent months. It is noteworthy that the decision to cut rates was not unanimous; Federal Reserve Governor Milan advocated for a larger 50-basis-point cut, while Kansas City Fed President Schmid favored keeping rates unchanged. This divergence reflects the complexity of the policy path.
At the press conference, Powell emphasized the policy tension between addressing inflation and supporting employment, stating that a single policy tool cannot simultaneously address both objectives. He indicated that policy rates are currently within many neutral interest rate valuation ranges, and if labor market data shows signs of stabilization or strengthening, it will influence future policy decisions. There is a growing consensus within the committee that remaining on the sidelines before taking further action might be more prudent. Furthermore, the Federal Reserve announced that it will end quantitative tightening on December 1st, ceasing the reduction of its securities holdings, marking a pause in the balance sheet reduction process.
The World Gold Council's Q3 2025 Gold Demand Trends report shows that global gold demand rose 3% year-on-year to 1,313 tons, a record high for a single quarter. Investment demand surged 47% to 537 tons, driven by inflows of 222 tons into gold ETFs and continued buying of gold bars and coins totaling 316 tons. Central bank gold purchases remained strong, reaching 220 tons in Q3, a 28% increase from the previous quarter, while jewelry consumption declined by 19% due to record high prices.
Global central banks continue to increase their gold purchases despite gold prices breaking through the historical high of $4,380. This price-insensitive allocation reflects deep concerns about the stability of the fiat currency system. The central bank of Kazakhstan leads the gold-buying frenzy, while Brazil rejoins the ranks of buyers after a four-year hiatus. The World Gold Council predicts that official sector gold purchases for the year will reach 750 to 900 tons, far exceeding the baseline level before the Russia-Ukraine conflict. This strategic reallocation highlights that central banks view gold as a core tool for hedging against systemic vulnerabilities, rather than a short-term speculative asset. Notably, approximately two-thirds of the latest gold demand is not included in official statistics; this "shadow buying" continues to tighten market liquidity, providing structural support for prices.
Observing the 60-minute chart, spot gold is showing a clear descending wedge consolidation pattern. The price has formed a downward-sloping parallel channel since the high of $4144.31, with a clear descending trendline connecting the highs, while the support line provides effective support around $3886.51. Currently, the gold price is trading in the lower half of the wedge pattern, approximately $87 from the lower support and $57 from the upper resistance.
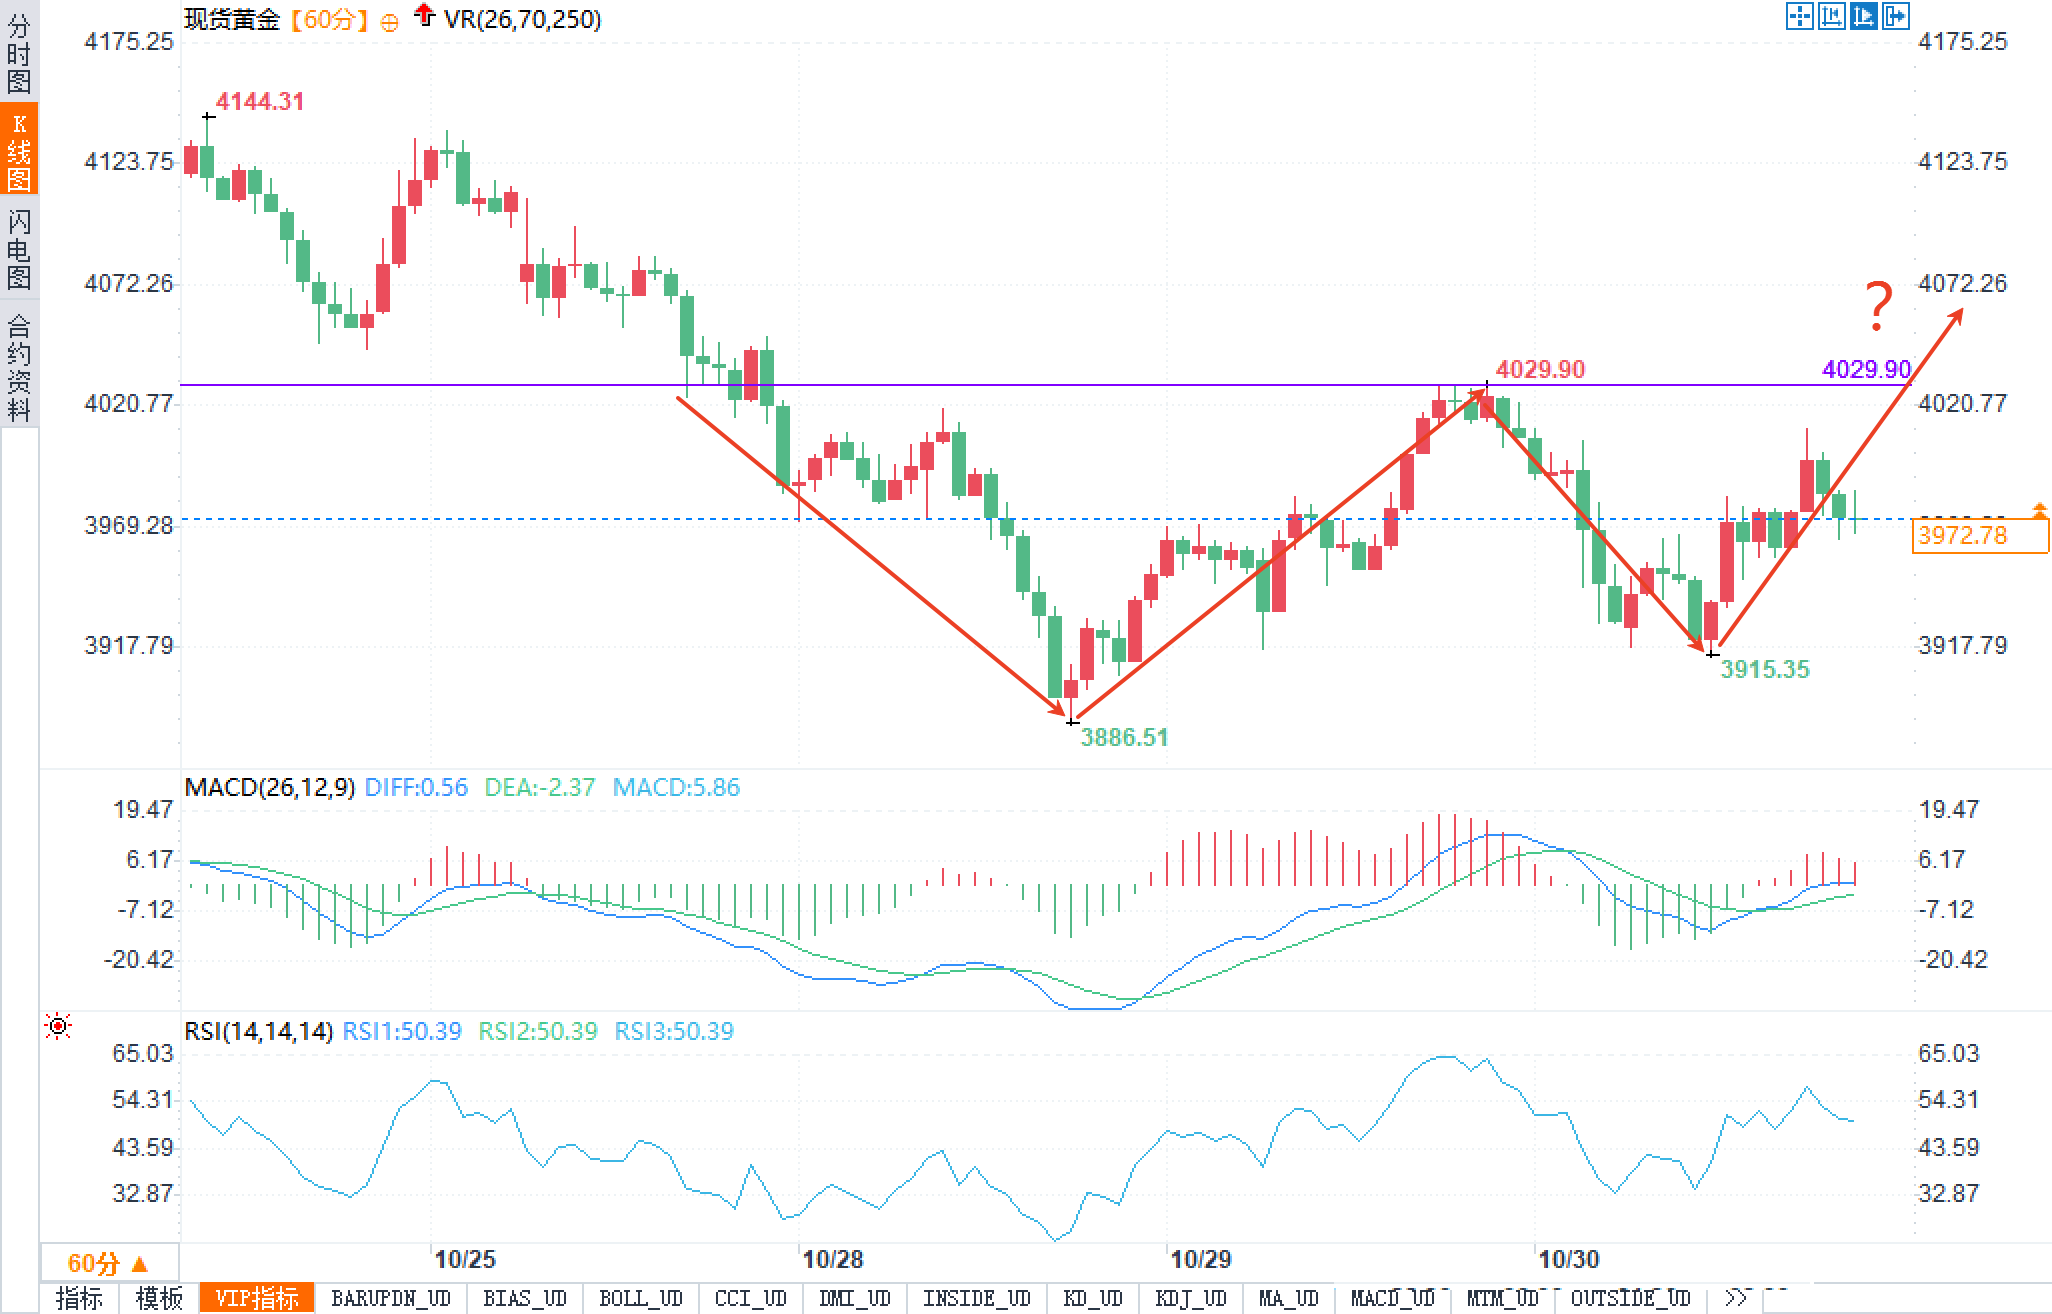
The MACD indicator is trading below the zero line, with the DIFF and DEA lines maintaining a bearish alignment. However, the MACD histogram shows the green histogram momentum gradually weakening. The DIFF line is at 0.56, the DEA line at -2.37, and the MACD histogram at -5.86. Although the indicators are still in bearish territory, the weakening momentum suggests a slight easing of downward pressure. If the DIFF line can cross above the DEA line to form a golden cross, it will constitute a short-term bullish signal.
The Relative Strength Index (RSI) (14) currently reads at approximately 50.39, placing it in the neutral zone. It has neither entered the overbought nor oversold zone. After falling to a low of 32.87, the RSI curve has begun to recover and is currently approaching the 50 midline, indicating that market sentiment is gradually returning to equilibrium from an extremely pessimistic state.
Based on wave structure analysis, gold prices may be in the final corrective wave of a descending wedge. If they can stabilize and break out of the wedge, a breakout upward impulsive wave is expected, targeting $4029.90 and the higher resistance level of $4070. However, if the key support level of $3886.51 is broken, the downtrend will continue, and the next support level may test the psychological level of $3850.
Current market sentiment is clearly cautious, with traders seeking a balance between signals of a Federal Reserve policy shift and continued central bank gold purchases. Powell's statement that a December rate cut is "far from a certainty" caused the implied probability of a December rate cut in federal funds rate futures to plummet from 70% to 45%, resulting in a sharp adjustment in market pricing. This reset of expectations is putting downward pressure on gold prices in the short term, as higher real interest rates increase the opportunity cost of holding interest-bearing assets.
However, central bank gold purchases reveal a long-term allocation logic quite different from market sentiment. Official sectors continued net buying even as gold prices approached historical highs. This price insensitivity reflects a strategic consideration for the long-term stability of the monetary system, rather than tactical trading based on short-term technical factors or interest rate conditions. This structural buying provides solid bottom support for gold prices, with each price pullback activating potential official demand.
The flow of funds into gold ETFs is also worth noting. A record $26 billion in net inflows in the third quarter indicates that institutions and high-net-worth individuals are reallocating their precious metal assets. While this inflow was somewhat hesitant following Powell's hawkish remarks, the central bank's demonstration effect provided confidence support. Market perception is shifting, with gold's monetary attributes and safe-haven function regaining importance in the current macroeconomic environment.
Fundamentals:
Federal Reserve Chairman Jerome Powell's remarks following this week's policy meeting became a key trigger for the recent gold price correction. The Fed cut interest rates by 25 basis points as expected, lowering the target range for the federal funds rate to 3.75%-4.00%, marking the second consecutive 25-basis-point "risk-management" rate cut. However, Powell explicitly stated at the press conference that "further rate cuts at the December meeting are far from a certainty," a hawkish statement that quickly boosted the dollar index and US Treasury yields, putting downward pressure on gold, a non-interest-bearing asset.
In its statement, the Monetary Policy Committee acknowledged that economic activity continued to expand at a moderate pace, but job growth had slowed and inflation remained slightly elevated. Policymakers considered the economic outlook to be highly uncertain, with downside risks to the labor market having increased in recent months. It is noteworthy that the decision to cut rates was not unanimous; Federal Reserve Governor Milan advocated for a larger 50-basis-point cut, while Kansas City Fed President Schmid favored keeping rates unchanged. This divergence reflects the complexity of the policy path.
At the press conference, Powell emphasized the policy tension between addressing inflation and supporting employment, stating that a single policy tool cannot simultaneously address both objectives. He indicated that policy rates are currently within many neutral interest rate valuation ranges, and if labor market data shows signs of stabilization or strengthening, it will influence future policy decisions. There is a growing consensus within the committee that remaining on the sidelines before taking further action might be more prudent. Furthermore, the Federal Reserve announced that it will end quantitative tightening on December 1st, ceasing the reduction of its securities holdings, marking a pause in the balance sheet reduction process.
The World Gold Council's Q3 2025 Gold Demand Trends report shows that global gold demand rose 3% year-on-year to 1,313 tons, a record high for a single quarter. Investment demand surged 47% to 537 tons, driven by inflows of 222 tons into gold ETFs and continued buying of gold bars and coins totaling 316 tons. Central bank gold purchases remained strong, reaching 220 tons in Q3, a 28% increase from the previous quarter, while jewelry consumption declined by 19% due to record high prices.
Global central banks continue to increase their gold purchases despite gold prices breaking through the historical high of $4,380. This price-insensitive allocation reflects deep concerns about the stability of the fiat currency system. The central bank of Kazakhstan leads the gold-buying frenzy, while Brazil rejoins the ranks of buyers after a four-year hiatus. The World Gold Council predicts that official sector gold purchases for the year will reach 750 to 900 tons, far exceeding the baseline level before the Russia-Ukraine conflict. This strategic reallocation highlights that central banks view gold as a core tool for hedging against systemic vulnerabilities, rather than a short-term speculative asset. Notably, approximately two-thirds of the latest gold demand is not included in official statistics; this "shadow buying" continues to tighten market liquidity, providing structural support for prices.
Technical Analysis:
Observing the 60-minute chart, spot gold is showing a clear descending wedge consolidation pattern. The price has formed a downward-sloping parallel channel since the high of $4144.31, with a clear descending trendline connecting the highs, while the support line provides effective support around $3886.51. Currently, the gold price is trading in the lower half of the wedge pattern, approximately $87 from the lower support and $57 from the upper resistance.
The MACD indicator is trading below the zero line, with the DIFF and DEA lines maintaining a bearish alignment. However, the MACD histogram shows the green histogram momentum gradually weakening. The DIFF line is at 0.56, the DEA line at -2.37, and the MACD histogram at -5.86. Although the indicators are still in bearish territory, the weakening momentum suggests a slight easing of downward pressure. If the DIFF line can cross above the DEA line to form a golden cross, it will constitute a short-term bullish signal.
The Relative Strength Index (RSI) (14) currently reads at approximately 50.39, placing it in the neutral zone. It has neither entered the overbought nor oversold zone. After falling to a low of 32.87, the RSI curve has begun to recover and is currently approaching the 50 midline, indicating that market sentiment is gradually returning to equilibrium from an extremely pessimistic state.
Based on wave structure analysis, gold prices may be in the final corrective wave of a descending wedge. If they can stabilize and break out of the wedge, a breakout upward impulsive wave is expected, targeting $4029.90 and the higher resistance level of $4070. However, if the key support level of $3886.51 is broken, the downtrend will continue, and the next support level may test the psychological level of $3850.
Market Sentiment Observation:
Current market sentiment is clearly cautious, with traders seeking a balance between signals of a Federal Reserve policy shift and continued central bank gold purchases. Powell's statement that a December rate cut is "far from a certainty" caused the implied probability of a December rate cut in federal funds rate futures to plummet from 70% to 45%, resulting in a sharp adjustment in market pricing. This reset of expectations is putting downward pressure on gold prices in the short term, as higher real interest rates increase the opportunity cost of holding interest-bearing assets.
However, central bank gold purchases reveal a long-term allocation logic quite different from market sentiment. Official sectors continued net buying even as gold prices approached historical highs. This price insensitivity reflects a strategic consideration for the long-term stability of the monetary system, rather than tactical trading based on short-term technical factors or interest rate conditions. This structural buying provides solid bottom support for gold prices, with each price pullback activating potential official demand.
The flow of funds into gold ETFs is also worth noting. A record $26 billion in net inflows in the third quarter indicates that institutions and high-net-worth individuals are reallocating their precious metal assets. While this inflow was somewhat hesitant following Powell's hawkish remarks, the central bank's demonstration effect provided confidence support. Market perception is shifting, with gold's monetary attributes and safe-haven function regaining importance in the current macroeconomic environment.
- Risk Warning and Disclaimer
- The market involves risk, and trading may not be suitable for all investors. This article is for reference only and does not constitute personal investment advice, nor does it take into account certain users’ specific investment objectives, financial situation, or other needs. Any investment decisions made based on this information are at your own risk.