Gold Analysis: Countdown to Venezuelan Airstrikes? Middle East Risks Haven't Dissipated, and South America Is Poised to Ignite Another Flame.
2025-10-31 21:55:24
On Friday (October 31), spot gold continued its sideways consolidation during the North American session, with the market remaining relatively calm around $4020. Despite a slight rebound in gold prices in the previous trading day, the continued strength of the US dollar index and rising US Treasury yields exerted downward pressure, limiting the bullish momentum. Following the policy meeting, Federal Reserve Chairman Powell released hawkish signals, downplaying the possibility of another rate cut in December and emphasizing that the policy path will depend on data performance. This statement significantly cooled market expectations for further easing this year.

Under the combined influence of fundamentals and technicals, the short-term outlook for gold prices is neutral to slightly weak. However, long-term supporting factors such as central bank gold purchases and geopolitical uncertainties remain solid, and the market is awaiting next week's US private sector data to provide new guidance for future price movements.
The US dollar index has been strong this week, currently holding steady above 99.50, after hitting a three-month high on Thursday. Meanwhile, US Treasury yields have risen across the board, with the benchmark 10-year yield climbing nearly 30 basis points since Wednesday, currently approaching a three-week high of 4.10%. This dual strength of the dollar and yields has directly limited the upside potential for gold prices. Market expectations for the Federal Reserve's policy path are undergoing subtle changes. The CME FedWatch Tool shows that the probability of a 25 basis point rate cut in December has fallen sharply from about 91.7% a week ago to around 66.8% currently. This shift stems from the cautious signals released by Powell in his recent policy statement, where he clearly stated that a December rate cut is not a certainty, and the policy decision will depend on upcoming economic data.
The US government shutdown has entered its fifth week, with no substantial progress made after the Senate adjourned on Thursday. Although senators plan to reconvene next Monday, negotiations remain deadlocked, and Trump's calls for Republicans to end their obstruction to push through the funding bill have not yet been effective. The shutdown has begun to delay the release of key economic data and has fueled market concerns about its broader economic impact. Next week will see the release of a series of US private sector data, including the ISM Manufacturing Purchasing Managers' Index, JOLTS job openings data, ADP employment change, the Challenger layoffs report, the University of Michigan consumer confidence survey, and the New York Fed's inflation expectations survey. These data will provide traders with important clues about the labor market and inflation outlook, thereby influencing their assessment of the Fed's future policy direction.
Of particular note is media reporting that the United States is about to authorize strikes against military targets in Venezuela. Sources indicate this is not a crackdown on drug trafficking, but rather an airstrike targeting military facilities, potentially taking place within days or even hours, aimed at dismantling the command structure of drug cartels. This news caused international oil prices to rise, but since Venezuela is no longer a major oil exporter, with daily exports ranging from 700,000 to 900,000 barrels, the actual impact on global energy supply is limited. Nevertheless, this development adds to geopolitical uncertainty and may provide some support for gold prices.
Observing the 30-minute candlestick chart, spot gold is generally exhibiting a range-bound trading pattern. The price structure shows that after the previous upward wave from a low of $3915.35 to a high of $4046.13, gold prices have recently entered a period of consolidation at high levels. The price faces resistance at $4035.70, $4046.13, and $4060. On the downside, the psychological level of $4000.00 forms the first line of defense, with further support levels at $3988.91 and $3960.00, and the strongest support at the previous low of $3915.35.
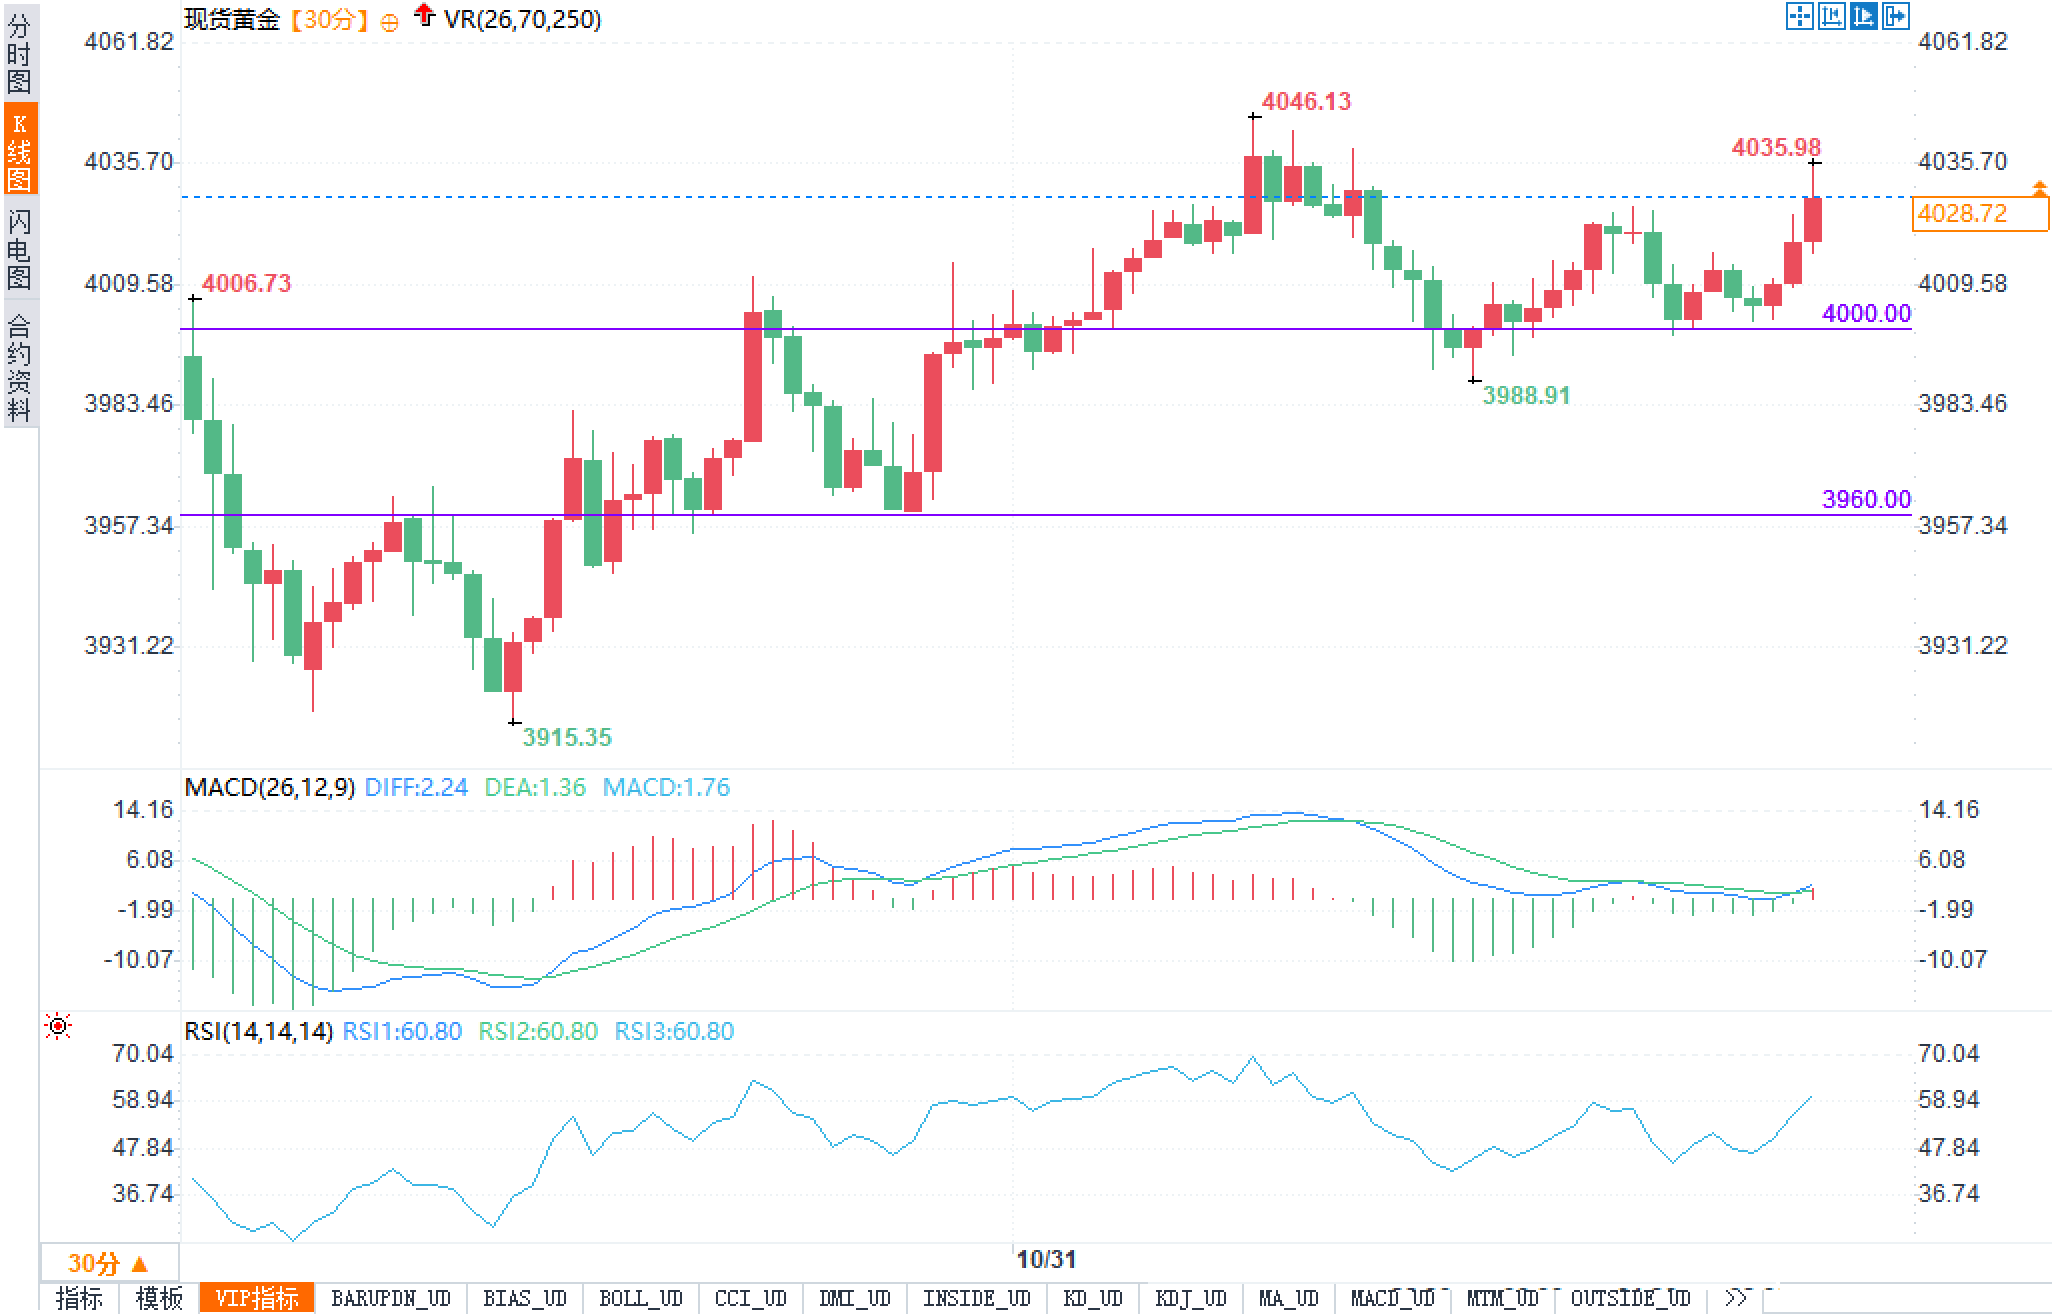
From the MACD indicator, the current DIFF value is 2.24, the DEA value is 1.36, and the MACD histogram value is 1.76. Although both the fast and slow lines remain above the zero axis, indicating that the medium-term trend is still bullish, the MACD histogram value is small and shows a converging trend, reflecting that the bullish momentum is weakening.
From a candlestick chart analysis, the left side of the chart shows a relatively smooth upward trend, with the price steadily climbing from $3915.35 to $4046.13. During this period, it tested support levels multiple times before continuing its upward movement, indicating a bullish dominance. However, the price encountered resistance after reaching the high of $4046.13 and subsequently fell back, entering a period of consolidation, reaching a low of $3988.91. Gold prices then rebounded again and are currently trading sideways around $4020. This pattern of repeatedly testing resistance levels but failing to break through effectively reveals a weakening of bullish momentum. If gold prices cannot break through $4046.13 with significant volume in the short term, there is a possibility of a downward retracement to test the $4000 support level.
Overall, the technical indicators on the 30-minute chart show a mixed picture of bullish and bearish trends. While the MACD is above the zero line, its momentum is weakening, and the RSI is neutral to slightly bullish but with limited upside potential. In terms of price structure, gold prices are trapped in a trading range between $4000 and $4046.13, and the short-term breakout direction remains unclear.
In the short term, spot gold is likely to continue its consolidation pattern within the $4,000 to $4,046.13 range. From a bullish perspective, although the probability of a Fed rate cut in December has decreased, market expectations for further easing in 2026 have not fundamentally wavered. If next week's US labor market data shows signs of weakness, such as a significant decline in JOLTS job openings or ADP employment figures significantly lower than expected, it will reinforcing market expectations for the Fed to restart its rate-cutting cycle. This could lead to a decline in the dollar and US Treasury yields, thus providing upward momentum for gold prices.
Furthermore, geopolitical risk premiums remain a long-term supporting factor for gold prices. The situation in Venezuela, the US government shutdown, and other potential global conflict hotspots could trigger a surge in risk aversion at any time. Central bank gold demand is also significant; the trend of many central banks continuously increasing their gold reserves has built a solid demand floor for gold prices. In this sense, every pullback in gold prices may provide a good entry point for long-term investment, and the support area below the psychological level of $4,000 is worth paying attention to.
From a bearish perspective, the continued strength of the US dollar index and the rise in US Treasury yields constitute the main obstacles to the rise in gold prices. If the ISM Manufacturing PMI and the University of Michigan Consumer Sentiment Index, which are released next week, are better than expected, it will further solidify market confidence in the resilience of the US economy, and the Federal Reserve may maintain a high-interest-rate environment for an extended period, which is obviously a negative factor for gold, a non-interest-bearing asset.
Under the combined influence of fundamentals and technicals, the short-term outlook for gold prices is neutral to slightly weak. However, long-term supporting factors such as central bank gold purchases and geopolitical uncertainties remain solid, and the market is awaiting next week's US private sector data to provide new guidance for future price movements.
Fundamentals:
The US dollar index has been strong this week, currently holding steady above 99.50, after hitting a three-month high on Thursday. Meanwhile, US Treasury yields have risen across the board, with the benchmark 10-year yield climbing nearly 30 basis points since Wednesday, currently approaching a three-week high of 4.10%. This dual strength of the dollar and yields has directly limited the upside potential for gold prices. Market expectations for the Federal Reserve's policy path are undergoing subtle changes. The CME FedWatch Tool shows that the probability of a 25 basis point rate cut in December has fallen sharply from about 91.7% a week ago to around 66.8% currently. This shift stems from the cautious signals released by Powell in his recent policy statement, where he clearly stated that a December rate cut is not a certainty, and the policy decision will depend on upcoming economic data.
The US government shutdown has entered its fifth week, with no substantial progress made after the Senate adjourned on Thursday. Although senators plan to reconvene next Monday, negotiations remain deadlocked, and Trump's calls for Republicans to end their obstruction to push through the funding bill have not yet been effective. The shutdown has begun to delay the release of key economic data and has fueled market concerns about its broader economic impact. Next week will see the release of a series of US private sector data, including the ISM Manufacturing Purchasing Managers' Index, JOLTS job openings data, ADP employment change, the Challenger layoffs report, the University of Michigan consumer confidence survey, and the New York Fed's inflation expectations survey. These data will provide traders with important clues about the labor market and inflation outlook, thereby influencing their assessment of the Fed's future policy direction.
Of particular note is media reporting that the United States is about to authorize strikes against military targets in Venezuela. Sources indicate this is not a crackdown on drug trafficking, but rather an airstrike targeting military facilities, potentially taking place within days or even hours, aimed at dismantling the command structure of drug cartels. This news caused international oil prices to rise, but since Venezuela is no longer a major oil exporter, with daily exports ranging from 700,000 to 900,000 barrels, the actual impact on global energy supply is limited. Nevertheless, this development adds to geopolitical uncertainty and may provide some support for gold prices.
Technical aspects:
Observing the 30-minute candlestick chart, spot gold is generally exhibiting a range-bound trading pattern. The price structure shows that after the previous upward wave from a low of $3915.35 to a high of $4046.13, gold prices have recently entered a period of consolidation at high levels. The price faces resistance at $4035.70, $4046.13, and $4060. On the downside, the psychological level of $4000.00 forms the first line of defense, with further support levels at $3988.91 and $3960.00, and the strongest support at the previous low of $3915.35.
From the MACD indicator, the current DIFF value is 2.24, the DEA value is 1.36, and the MACD histogram value is 1.76. Although both the fast and slow lines remain above the zero axis, indicating that the medium-term trend is still bullish, the MACD histogram value is small and shows a converging trend, reflecting that the bullish momentum is weakening.
From a candlestick chart analysis, the left side of the chart shows a relatively smooth upward trend, with the price steadily climbing from $3915.35 to $4046.13. During this period, it tested support levels multiple times before continuing its upward movement, indicating a bullish dominance. However, the price encountered resistance after reaching the high of $4046.13 and subsequently fell back, entering a period of consolidation, reaching a low of $3988.91. Gold prices then rebounded again and are currently trading sideways around $4020. This pattern of repeatedly testing resistance levels but failing to break through effectively reveals a weakening of bullish momentum. If gold prices cannot break through $4046.13 with significant volume in the short term, there is a possibility of a downward retracement to test the $4000 support level.
Overall, the technical indicators on the 30-minute chart show a mixed picture of bullish and bearish trends. While the MACD is above the zero line, its momentum is weakening, and the RSI is neutral to slightly bullish but with limited upside potential. In terms of price structure, gold prices are trapped in a trading range between $4000 and $4046.13, and the short-term breakout direction remains unclear.
Market Outlook: The volatile pattern will continue; key data will determine the direction.
In the short term, spot gold is likely to continue its consolidation pattern within the $4,000 to $4,046.13 range. From a bullish perspective, although the probability of a Fed rate cut in December has decreased, market expectations for further easing in 2026 have not fundamentally wavered. If next week's US labor market data shows signs of weakness, such as a significant decline in JOLTS job openings or ADP employment figures significantly lower than expected, it will reinforcing market expectations for the Fed to restart its rate-cutting cycle. This could lead to a decline in the dollar and US Treasury yields, thus providing upward momentum for gold prices.
Furthermore, geopolitical risk premiums remain a long-term supporting factor for gold prices. The situation in Venezuela, the US government shutdown, and other potential global conflict hotspots could trigger a surge in risk aversion at any time. Central bank gold demand is also significant; the trend of many central banks continuously increasing their gold reserves has built a solid demand floor for gold prices. In this sense, every pullback in gold prices may provide a good entry point for long-term investment, and the support area below the psychological level of $4,000 is worth paying attention to.
From a bearish perspective, the continued strength of the US dollar index and the rise in US Treasury yields constitute the main obstacles to the rise in gold prices. If the ISM Manufacturing PMI and the University of Michigan Consumer Sentiment Index, which are released next week, are better than expected, it will further solidify market confidence in the resilience of the US economy, and the Federal Reserve may maintain a high-interest-rate environment for an extended period, which is obviously a negative factor for gold, a non-interest-bearing asset.
- Risk Warning and Disclaimer
- The market involves risk, and trading may not be suitable for all investors. This article is for reference only and does not constitute personal investment advice, nor does it take into account certain users’ specific investment objectives, financial situation, or other needs. Any investment decisions made based on this information are at your own risk.