Silver's outperformance: a signal of a new cycle or the peak of the rally?
2025-12-11 01:46:10
While the overall market consolidated below key resistance levels, silver demand and prices surged, reaching record highs and holding near the $62 mark ahead of the Federal Reserve's (FOMC) meeting. This significant divergence has sparked heated debate: Is silver leading the market into a new cycle, or is it the last asset to outperform in this bull market? This question is particularly crucial given the increasing correlation between gold, silver, and US stock indices. This article will analyze the S&P 500 and silver price movements, combining overall market performance, policy environment, and technical analysis, to explore the core logic behind silver's outperformance and its future trajectory.

Market Background: Divergent Market Trends Driven by Both Policy and Capital Inflows
The current market is experiencing a surge in silver prices, driven by both the upcoming Federal Reserve interest rate meeting and year-end liquidity. Silver prices have broken through historical record levels and stabilized above $62, while the overall market remains under pressure below its 2025 historical high. This divergence is not only reflected in prices but also deeply in market sentiment. Looking back at the market environment, the policy adjustments and tariff reforms implemented after the new president took office led to a year-long period of market exhaustion, causing various asset prices to enter extreme ranges. Historically, a president's second term often accompanies a market consolidation phase, completing a "reset" before the next bull market begins. This context provides an important reference for the current divergence between silver and the overall market.
The current market also exhibits three significant characteristics: First, major US stock indices continue to be pressured below key resistance levels, lacking upward momentum; second, gold prices remain below the $4,200 mark, still more than $150 away from historical records, failing to replicate the strong performance of silver; third, there is uncertainty in the market's judgment of seasonal trends, and only after various asset prices clearly break through the historical highs of 2025 can it be determined whether a "Santa Claus rally" will begin or the continuation of the consolidation pattern will continue.
Key Question: Two Possibilities for Silver's Outperformance
The core disagreement in the market focuses on the nature of silver's outperformance: on the one hand, some believe silver is the last asset to outperform in this long bull market, and the current surge may be the tail end of the rally; on the other hand, others argue that silver, with its increasing importance in the booming technology sector, is leading the market into a new cycle. From a long-term fundamental perspective, global technology and green industry development plans provide solid support for silver demand, and the outlook remains bullish. However, the current outperformance also means that silver faces the risk of a significant correction before the trend officially restarts.
Technical Analysis: Silver Price Outlook Across Multiple Timeframes
Combining technical charts across multiple timeframes, such as weekly and three-month charts, can further clarify the potential direction of silver's price movement. The following analysis will focus on the technical characteristics of different timeframes:
Weekly chart: Breakout from the upward channel, bullish sentiment continues.
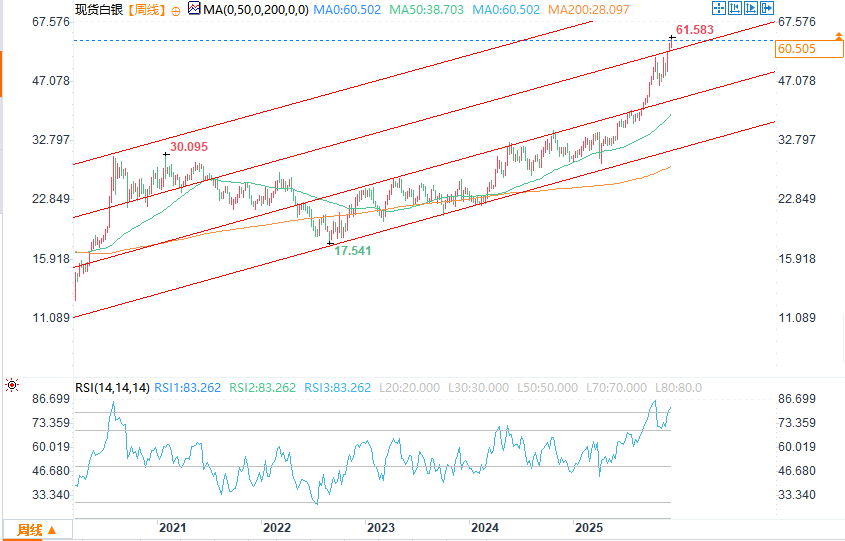
(Spot silver weekly chart source: EasyTrade)
From the weekly chart (logarithmic scale), silver prices have successfully broken through the upper rail of the replicating upward channel that has been suppressing the price movement since the 2022 lows, entering the third replicating upward channel. This signal suggests that bullish sentiment in the market is likely to continue. From the perspective of Elliott Wave Theory, the fifth wave of commodities typically exhibits an extended trend, and the current five-wave upward movement in silver, which began in 2022, is currently showing this characteristic. Based on this technical logic, the market may see two possible scenarios:
Upside potential: If silver prices can hold above the $63 mark, the gains are expected to extend further towards the middle and upper rails of the third upward channel, with target prices of $65 and $70 respectively.
Downside risk: If silver prices fall below the upper rail of the second ascending channel (i.e., break below $57), a pullback may be triggered, and the previous resistance level may turn into a support level. The pullback targets are $55 and $50, and in extreme cases, it may fall to $45 before the bull market trend can be restarted.
Three-month timeframe: Breakout above long-term resistance, key support level to be confirmed.
From a three-month timeframe (logarithmic scale), silver prices have broken through a 45-year resistance range established since the 1980s, successfully stabilizing above the $55 mark. If this breakout is effectively confirmed, it will lay a crucial foundation for further upward movement in silver. Specifically, if the upward momentum weakens, the $55 level will become a key support level for verifying the breakout's validity, and prices may complete a "pullback confirmation" at this level before launching an attack on the long-term target of three digits. However, it is also important to be wary that if market volatility intensifies, silver prices may experience a deep correction to the $50 or even $45 level before potentially resuming their upward trend.
A comprehensive analysis of the market background, fundamentals, and multi-dimensional technical factors suggests that silver's current outperformance implies both the potential to initiate a new cycle and the risk of a short-term pullback. In the short term, key attention should be paid to the impact of the Federal Reserve's interest rate meeting, the breakthrough of the key resistance level of $63, and the effectiveness of the support level at $57. In the medium to long term, the $55 level, as a key support after breaking through long-term resistance, will directly influence the pace of silver's progress towards its long-term target. Continued monitoring of the price movements of various assets and changes in market sentiment is necessary to more accurately grasp the trend direction of silver.
Market Background: Divergent Market Trends Driven by Both Policy and Capital Inflows
The current market is experiencing a surge in silver prices, driven by both the upcoming Federal Reserve interest rate meeting and year-end liquidity. Silver prices have broken through historical record levels and stabilized above $62, while the overall market remains under pressure below its 2025 historical high. This divergence is not only reflected in prices but also deeply in market sentiment. Looking back at the market environment, the policy adjustments and tariff reforms implemented after the new president took office led to a year-long period of market exhaustion, causing various asset prices to enter extreme ranges. Historically, a president's second term often accompanies a market consolidation phase, completing a "reset" before the next bull market begins. This context provides an important reference for the current divergence between silver and the overall market.
The current market also exhibits three significant characteristics: First, major US stock indices continue to be pressured below key resistance levels, lacking upward momentum; second, gold prices remain below the $4,200 mark, still more than $150 away from historical records, failing to replicate the strong performance of silver; third, there is uncertainty in the market's judgment of seasonal trends, and only after various asset prices clearly break through the historical highs of 2025 can it be determined whether a "Santa Claus rally" will begin or the continuation of the consolidation pattern will continue.
Key Question: Two Possibilities for Silver's Outperformance
The core disagreement in the market focuses on the nature of silver's outperformance: on the one hand, some believe silver is the last asset to outperform in this long bull market, and the current surge may be the tail end of the rally; on the other hand, others argue that silver, with its increasing importance in the booming technology sector, is leading the market into a new cycle. From a long-term fundamental perspective, global technology and green industry development plans provide solid support for silver demand, and the outlook remains bullish. However, the current outperformance also means that silver faces the risk of a significant correction before the trend officially restarts.
Technical Analysis: Silver Price Outlook Across Multiple Timeframes
Combining technical charts across multiple timeframes, such as weekly and three-month charts, can further clarify the potential direction of silver's price movement. The following analysis will focus on the technical characteristics of different timeframes:
Weekly chart: Breakout from the upward channel, bullish sentiment continues.
(Spot silver weekly chart source: EasyTrade)
From the weekly chart (logarithmic scale), silver prices have successfully broken through the upper rail of the replicating upward channel that has been suppressing the price movement since the 2022 lows, entering the third replicating upward channel. This signal suggests that bullish sentiment in the market is likely to continue. From the perspective of Elliott Wave Theory, the fifth wave of commodities typically exhibits an extended trend, and the current five-wave upward movement in silver, which began in 2022, is currently showing this characteristic. Based on this technical logic, the market may see two possible scenarios:
Upside potential: If silver prices can hold above the $63 mark, the gains are expected to extend further towards the middle and upper rails of the third upward channel, with target prices of $65 and $70 respectively.
Downside risk: If silver prices fall below the upper rail of the second ascending channel (i.e., break below $57), a pullback may be triggered, and the previous resistance level may turn into a support level. The pullback targets are $55 and $50, and in extreme cases, it may fall to $45 before the bull market trend can be restarted.
Three-month timeframe: Breakout above long-term resistance, key support level to be confirmed.
From a three-month timeframe (logarithmic scale), silver prices have broken through a 45-year resistance range established since the 1980s, successfully stabilizing above the $55 mark. If this breakout is effectively confirmed, it will lay a crucial foundation for further upward movement in silver. Specifically, if the upward momentum weakens, the $55 level will become a key support level for verifying the breakout's validity, and prices may complete a "pullback confirmation" at this level before launching an attack on the long-term target of three digits. However, it is also important to be wary that if market volatility intensifies, silver prices may experience a deep correction to the $50 or even $45 level before potentially resuming their upward trend.
A comprehensive analysis of the market background, fundamentals, and multi-dimensional technical factors suggests that silver's current outperformance implies both the potential to initiate a new cycle and the risk of a short-term pullback. In the short term, key attention should be paid to the impact of the Federal Reserve's interest rate meeting, the breakthrough of the key resistance level of $63, and the effectiveness of the support level at $57. In the medium to long term, the $55 level, as a key support after breaking through long-term resistance, will directly influence the pace of silver's progress towards its long-term target. Continued monitoring of the price movements of various assets and changes in market sentiment is necessary to more accurately grasp the trend direction of silver.
- Risk Warning and Disclaimer
- The market involves risk, and trading may not be suitable for all investors. This article is for reference only and does not constitute personal investment advice, nor does it take into account certain users’ specific investment objectives, financial situation, or other needs. Any investment decisions made based on this information are at your own risk.