Indicators Fail? Lessons from Gold Investment in 2025
2025-12-15 19:05:21
The gold price surge in 2025 shattered all traditional rules of momentum trading and market psychology. This article summarizes key insights for traders that can be applied up to 2026.
2025 taught traders the most profound lesson in a decade: in a parabolic upward trend, overbought conditions are not a sell signal. With gold's year-to-date gain reaching an unprecedented 64%, repeatedly breaking historical extremes in the Relative Strength Index (RSI) and overturning traditional momentum logic, shorting gold without risk hedging became a heavy burden for traders this year.
In early 2025, gold opened at nearly $2,624 per ounce, then rose almost $900 to a high of $3,500. It then entered a five-month period of narrow consolidation, forming a continuation pattern before rising another $900, aiming for the $4,400 mark. Trend-following traders and hedgers who positioned themselves in line with Trump's new policy cycle reaped exponential gains. However, for short sellers clinging to the "overheated market" view, the continued rise in gold prices brought their portfolios to the brink of collapse—not due to a trend reversal, but rather because the upward trend resumed after a brief consolidation.
This phenomenon raises a deeper question for global investors: How much room is there for gold to rise? And how much confidence does the market have in the current monetary and financial system?

Monthly chart of gold and S&P 500 index (percentage axis)
For the first time in many years, gold and US stock indices have shown a strong positive correlation, with both assets simultaneously embarking on exponential price increases. Gold has played a dual role in this rally:
Safe-haven assets during geopolitical conflicts
Liquidity-benefiting assets during a risk appetite upturn
A weakening dollar, expectations of dovish policies following the Trump administration's inauguration, and continued gold purchases by central banks worldwide have collectively reinforced this bull market cycle. With these multiple factors combined, gold prices are expected to remain in a state of either one-sided upward movement or consolidation throughout 2025, rendering traditional overbought trading strategies largely ineffective during this period.
Will gold experience a deep correction? The answer is most likely yes, but we need to wait for a clear signal from the key technical levels on the monthly chart.
Key Technological Forms and Future Implications
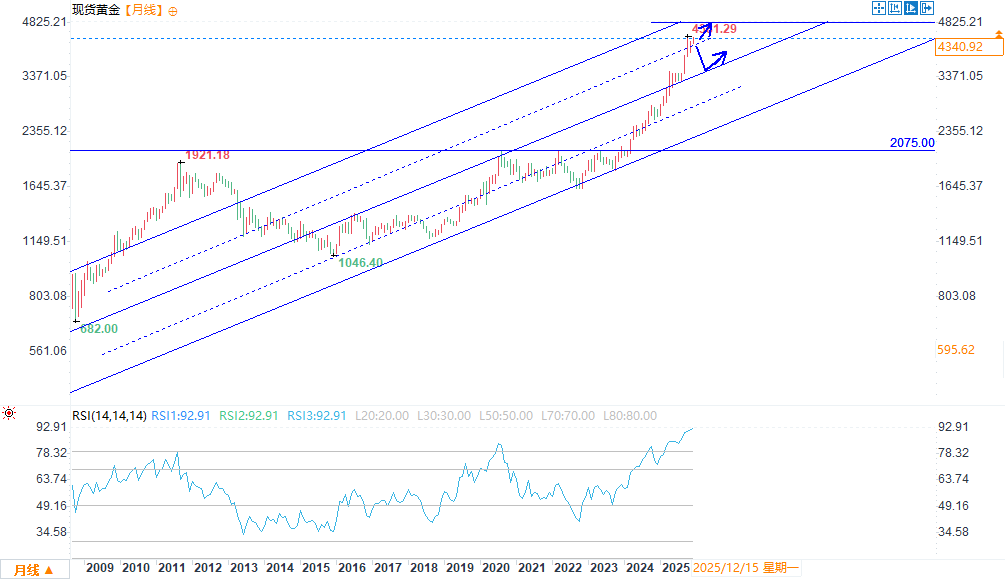
Gold monthly chart (logarithmic scale) Image source: EasyForex
1. The cup handle shape has achieved a breakthrough.
Gold's recent move to a peak near $4,400, coinciding with a Relative Strength Index (RSI) reaching a historic high of 93, perfectly mirrors the measured gains of a cup and handle pattern that began in 2011 and has lasted for over a decade. This range also serves as a natural window for observing market momentum exhaustion and trend reversals.
2. Pressure is exerted on the middle rail of the double upward channel.
Gold prices are currently trading at the middle of the double upward channel formed during the 2016-2025 gold price surge. Historically, the middle channel often represents a balance between bullish and bearish forces, where prices are likely to stagnate, consolidate, or even retrace before initiating a new trend.
However, there's an old saying in the trading market: trend is king, until a clear reversal signal appears. As long as gold continues to break through key psychological and technical resistance levels, the overall bullish trend will not change.
Currently, mainstream market opinions, including those of several US investment banks, have raised their target price for gold to $5,000 per ounce. If gold can achieve a stable breakout above $4,400 on the monthly chart, this target will be feasible, and the price could then challenge the upper trendline of the dual long-term upward channel (around $5,000).
However, it's important to note that gold is currently in the neutral zone of the channel's middle line, where trend hesitation or pullbacks often brew. Before the next upward move begins, there is a reasonable risk that gold prices may fall back to the $3700-$3500 channel support range. Such a pullback will not change the core bullish trend, but traders need to closely monitor trend reversal signals and key breakout points to avoid being trapped in bullish or bearish traps and suffering losses from prolonged consolidation. Currently, $3900 is a crucial support/resistance level; a breach of this level could signal a larger-scale pullback.
2025 taught traders the most profound lesson in a decade: in a parabolic upward trend, overbought conditions are not a sell signal. With gold's year-to-date gain reaching an unprecedented 64%, repeatedly breaking historical extremes in the Relative Strength Index (RSI) and overturning traditional momentum logic, shorting gold without risk hedging became a heavy burden for traders this year.
In early 2025, gold opened at nearly $2,624 per ounce, then rose almost $900 to a high of $3,500. It then entered a five-month period of narrow consolidation, forming a continuation pattern before rising another $900, aiming for the $4,400 mark. Trend-following traders and hedgers who positioned themselves in line with Trump's new policy cycle reaped exponential gains. However, for short sellers clinging to the "overheated market" view, the continued rise in gold prices brought their portfolios to the brink of collapse—not due to a trend reversal, but rather because the upward trend resumed after a brief consolidation.
This phenomenon raises a deeper question for global investors: How much room is there for gold to rise? And how much confidence does the market have in the current monetary and financial system?
Monthly chart of gold and S&P 500 index (percentage axis)
For the first time in many years, gold and US stock indices have shown a strong positive correlation, with both assets simultaneously embarking on exponential price increases. Gold has played a dual role in this rally:
Safe-haven assets during geopolitical conflicts
Liquidity-benefiting assets during a risk appetite upturn
A weakening dollar, expectations of dovish policies following the Trump administration's inauguration, and continued gold purchases by central banks worldwide have collectively reinforced this bull market cycle. With these multiple factors combined, gold prices are expected to remain in a state of either one-sided upward movement or consolidation throughout 2025, rendering traditional overbought trading strategies largely ineffective during this period.
Will gold experience a deep correction? The answer is most likely yes, but we need to wait for a clear signal from the key technical levels on the monthly chart.
Key Technological Forms and Future Implications
Gold monthly chart (logarithmic scale) Image source: EasyForex
1. The cup handle shape has achieved a breakthrough.
Gold's recent move to a peak near $4,400, coinciding with a Relative Strength Index (RSI) reaching a historic high of 93, perfectly mirrors the measured gains of a cup and handle pattern that began in 2011 and has lasted for over a decade. This range also serves as a natural window for observing market momentum exhaustion and trend reversals.
2. Pressure is exerted on the middle rail of the double upward channel.
Gold prices are currently trading at the middle of the double upward channel formed during the 2016-2025 gold price surge. Historically, the middle channel often represents a balance between bullish and bearish forces, where prices are likely to stagnate, consolidate, or even retrace before initiating a new trend.
However, there's an old saying in the trading market: trend is king, until a clear reversal signal appears. As long as gold continues to break through key psychological and technical resistance levels, the overall bullish trend will not change.
Currently, mainstream market opinions, including those of several US investment banks, have raised their target price for gold to $5,000 per ounce. If gold can achieve a stable breakout above $4,400 on the monthly chart, this target will be feasible, and the price could then challenge the upper trendline of the dual long-term upward channel (around $5,000).
However, it's important to note that gold is currently in the neutral zone of the channel's middle line, where trend hesitation or pullbacks often brew. Before the next upward move begins, there is a reasonable risk that gold prices may fall back to the $3700-$3500 channel support range. Such a pullback will not change the core bullish trend, but traders need to closely monitor trend reversal signals and key breakout points to avoid being trapped in bullish or bearish traps and suffering losses from prolonged consolidation. Currently, $3900 is a crucial support/resistance level; a breach of this level could signal a larger-scale pullback.
- Risk Warning and Disclaimer
- The market involves risk, and trading may not be suitable for all investors. This article is for reference only and does not constitute personal investment advice, nor does it take into account certain users’ specific investment objectives, financial situation, or other needs. Any investment decisions made based on this information are at your own risk.