With the supply side resorting to "robbing Peter to pay Paul," how long can oil prices continue to rise?
2026-01-08 21:29:52
On Thursday (January 8), US crude oil prices traded around $56.80 during the North American session, continuing their recovery but showing hesitation in upward movement. Previously, the market had shifted from a rapid decline to range-bound trading amid repeated supply and demand dynamics, with short-term bulls and bears seemingly waiting for a new trigger to break the equilibrium.

The immediate catalyst for this rebound came from an "unexpected tightening" of inventories. The latest weekly data showed that U.S. crude oil inventories decreased by 3.831 million barrels, significantly larger than the previous week and contrary to market expectations of an increase. An unexpected decline in inventories is typically interpreted as stronger spot demand or more aggressive restocking by refineries, thus providing immediate support for oil prices and driving U.S. crude oil prices to rebound from their lows.
However, the upside potential isn't solely determined by demand. Policy and geopolitical supply variables are adding to the upper limit. US President Trump mentioned that Venezuela might export approximately $2 billion worth of crude oil to the US, while the US signaled its desire for long-term control over related sales and revenue arrangements. For the market, such statements reinforce the expectation of "additional supply entering the North American market," making investors more cautious when chasing prices, and causing any rebound to slow down at key resistance levels.
Furthermore, the "stability" on the oil-producing side does not necessarily indicate a shortage. Surveys show that OPEC's overall production in December was largely stable, averaging slightly above 29 million barrels per day. Venezuela's daily production fell by about 14% to 830,000 barrels, a two-year low, due to tanker seizures, but increased production from member countries like Iraq offset this shortfall. Iraq's daily production increased by 80,000 barrels to 4.37 million barrels, and its actual output was significantly higher than its OPEC+ quota. Meanwhile, the eight major member countries agreed to freeze production in the first quarter and suspend previous large-scale production increases. Overall, the supply side exhibits a pattern of "structural fluctuations but overall stability": it is neither likely to immediately push up the shortage premium, nor too low to continuously remind the market that supply elasticity remains even when oil prices rebound, thus suppressing a sustained unilateral upward trend.
On the macroeconomic front, the market is focused on the upcoming US December jobs report. If signs of a cooling job market strengthen, it typically supports oil prices by weakening the dollar and enhancing the financial attributes of dollar-denominated commodities; conversely, if the data is strong, a stronger dollar could temporarily constrain oil prices. With key data approaching, the market often enters a period of "volatility convergence," characterized by a lack of sustained upward momentum and downward movements relying more on new negative catalysts.
From the daily candlestick chart, WTI crude oil first formed a high near 61.28, then fell back and encountered resistance again near 60.50, confirming the existence of the selling pressure zone above. The price then continued to decline, hitting a low near 54.98, completing a clear downtrend. Currently, at $56.80, it is in a pullback zone after a rebound: 58.00 is a clear horizontal resistance line, and past candlesticks have shown multiple rallies and pullbacks in this area, indicating that this is a densely traded area that short-term bulls need to digest repeatedly; the 57.00 level is more like a "pivot point," with prices fluctuating around it, suggesting that the market is in a consolidation phase rather than a one-sided trend. Below, 56.00 forms a near-term static support level. If this level is effectively broken, the previous low of 54.98 will once again become a key defense line for the market.
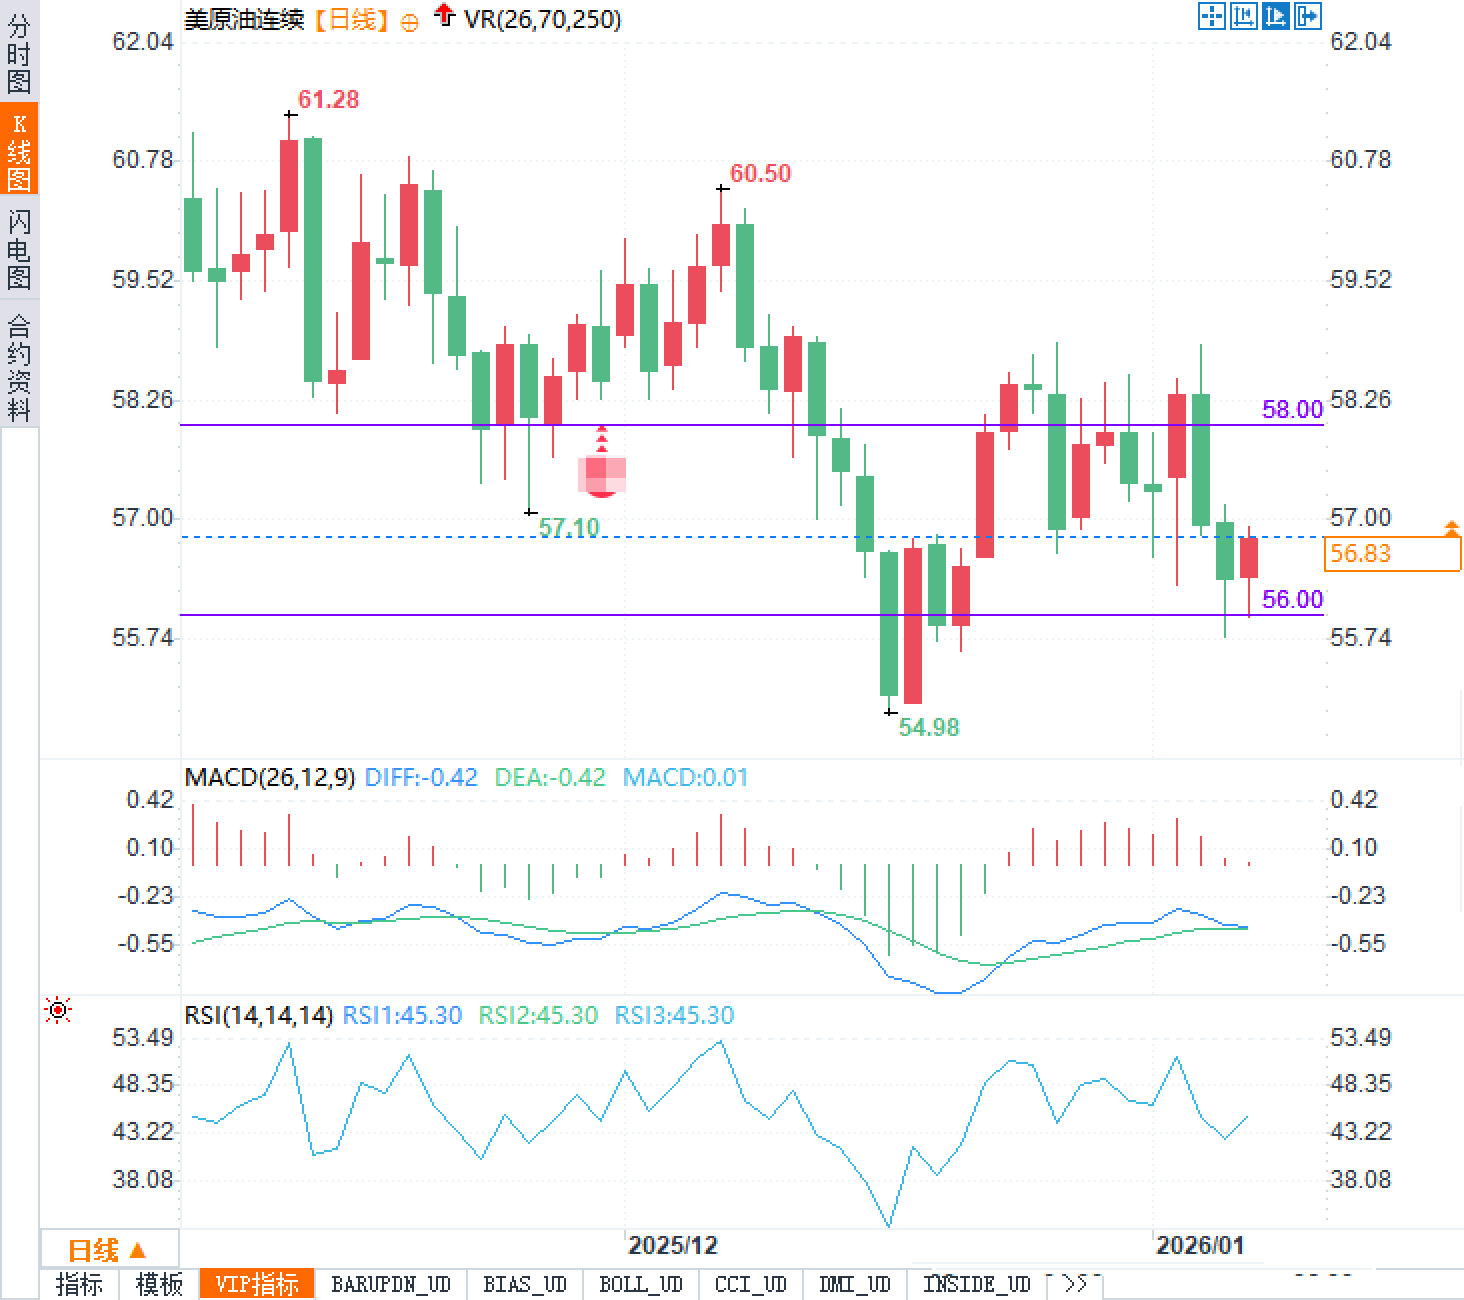
In terms of indicators, MACD (26,12,9) shows DIFF at -0.42 and DEA at -0.42, with the histogram at approximately 0.01, indicating that while the downward momentum has clearly weakened, the trend has not yet been confirmed as a strong reversal. RSI (14) is around 45.30, in a weak range but not yet in extreme oversold territory, consistent with the oscillation characteristic of "rebound followed by pullback, then choosing a direction again." Overall, the technical structure is more inclined towards a range-bound consolidation: before 58.00 is effectively broken, the upward movement will mainly consist of technical rebounds and pullbacks; if 56.00 is repeatedly tested and the volume fails to stabilize, the short-term risk of a downward break will be amplified.
When declining inventories bring positive demand, market sentiment often shifts from fear to cautious optimism. However, once this is combined with the narrative of potential new supply and stable production by oil-producing countries, sentiment quickly returns to "don't chase highs." This sentiment structure manifests on the chart as selling pressure around 58.00 during rebounds and buying support around 56.00 during pullbacks, indicating that funds tend to trade within a range rather than betting on a trend.
Meanwhile, the approaching macroeconomic data release window will prompt traders to reduce their directional exposure: on the one hand, to avoid betting on one side before key data releases, and on the other hand, to control overnight risk by shortening holding periods. Non-extreme sentiment, converging volatility, and repeated fluctuations around key price levels constitute the main "feelings" of the current market.
Bullish Outlook: If inventory levels continue to decline and macroeconomic data weakens the US dollar, US crude oil has a chance to consolidate above 56.00 and retest the 57.00-58.00 range. Only if 58.00 is broken and held with significant volume will the market potentially shift from a "range-bound rebound" to a "trend correction," opening up more upside potential. At that point, the 60.50 level will become a crucial reference point again.
Bearish Outlook: If supply expectations strengthen further, such as increased pricing of additional supply in the North American market, while demand-side positive factors fail to materialize, prices may repeatedly test the 56.00 level after encountering resistance at 58.00. Once 56.00 is breached, market attention will quickly shift to the previous low of 54.98; if this low is also broken, it signifies a continuation of the downtrend, and the market will move from consolidation to a new round of downward movement.
In summary, US crude oil around $56.80 appears to be in a "recovery phase after a downtrend": fundamentals provide support, but supply narratives limit the upside; technical indicators show clear key price levels and neutral-to-weak momentum. The key short-term focus remains on whether the $57.00 pivot point and the $58.00 resistance level can be effectively broken, and whether the $56.00 support level shows sufficient resilience during pullbacks.
Fundamentals: Declining inventories provide a floor, while supply expectations exert downward pressure on the upper limit.
The immediate catalyst for this rebound came from an "unexpected tightening" of inventories. The latest weekly data showed that U.S. crude oil inventories decreased by 3.831 million barrels, significantly larger than the previous week and contrary to market expectations of an increase. An unexpected decline in inventories is typically interpreted as stronger spot demand or more aggressive restocking by refineries, thus providing immediate support for oil prices and driving U.S. crude oil prices to rebound from their lows.
However, the upside potential isn't solely determined by demand. Policy and geopolitical supply variables are adding to the upper limit. US President Trump mentioned that Venezuela might export approximately $2 billion worth of crude oil to the US, while the US signaled its desire for long-term control over related sales and revenue arrangements. For the market, such statements reinforce the expectation of "additional supply entering the North American market," making investors more cautious when chasing prices, and causing any rebound to slow down at key resistance levels.
Furthermore, the "stability" on the oil-producing side does not necessarily indicate a shortage. Surveys show that OPEC's overall production in December was largely stable, averaging slightly above 29 million barrels per day. Venezuela's daily production fell by about 14% to 830,000 barrels, a two-year low, due to tanker seizures, but increased production from member countries like Iraq offset this shortfall. Iraq's daily production increased by 80,000 barrels to 4.37 million barrels, and its actual output was significantly higher than its OPEC+ quota. Meanwhile, the eight major member countries agreed to freeze production in the first quarter and suspend previous large-scale production increases. Overall, the supply side exhibits a pattern of "structural fluctuations but overall stability": it is neither likely to immediately push up the shortage premium, nor too low to continuously remind the market that supply elasticity remains even when oil prices rebound, thus suppressing a sustained unilateral upward trend.
On the macroeconomic front, the market is focused on the upcoming US December jobs report. If signs of a cooling job market strengthen, it typically supports oil prices by weakening the dollar and enhancing the financial attributes of dollar-denominated commodities; conversely, if the data is strong, a stronger dollar could temporarily constrain oil prices. With key data approaching, the market often enters a period of "volatility convergence," characterized by a lack of sustained upward momentum and downward movements relying more on new negative catalysts.
Technical aspects:
From the daily candlestick chart, WTI crude oil first formed a high near 61.28, then fell back and encountered resistance again near 60.50, confirming the existence of the selling pressure zone above. The price then continued to decline, hitting a low near 54.98, completing a clear downtrend. Currently, at $56.80, it is in a pullback zone after a rebound: 58.00 is a clear horizontal resistance line, and past candlesticks have shown multiple rallies and pullbacks in this area, indicating that this is a densely traded area that short-term bulls need to digest repeatedly; the 57.00 level is more like a "pivot point," with prices fluctuating around it, suggesting that the market is in a consolidation phase rather than a one-sided trend. Below, 56.00 forms a near-term static support level. If this level is effectively broken, the previous low of 54.98 will once again become a key defense line for the market.
In terms of indicators, MACD (26,12,9) shows DIFF at -0.42 and DEA at -0.42, with the histogram at approximately 0.01, indicating that while the downward momentum has clearly weakened, the trend has not yet been confirmed as a strong reversal. RSI (14) is around 45.30, in a weak range but not yet in extreme oversold territory, consistent with the oscillation characteristic of "rebound followed by pullback, then choosing a direction again." Overall, the technical structure is more inclined towards a range-bound consolidation: before 58.00 is effectively broken, the upward movement will mainly consist of technical rebounds and pullbacks; if 56.00 is repeatedly tested and the volume fails to stabilize, the short-term risk of a downward break will be amplified.
Market Sentiment Observation: Bulls have reasons, but lack the "courage to chase" momentum.
When declining inventories bring positive demand, market sentiment often shifts from fear to cautious optimism. However, once this is combined with the narrative of potential new supply and stable production by oil-producing countries, sentiment quickly returns to "don't chase highs." This sentiment structure manifests on the chart as selling pressure around 58.00 during rebounds and buying support around 56.00 during pullbacks, indicating that funds tend to trade within a range rather than betting on a trend.
Meanwhile, the approaching macroeconomic data release window will prompt traders to reduce their directional exposure: on the one hand, to avoid betting on one side before key data releases, and on the other hand, to control overnight risk by shortening holding periods. Non-extreme sentiment, converging volatility, and repeated fluctuations around key price levels constitute the main "feelings" of the current market.
Market Outlook: Short-term outlook is range-bound; a breakout is needed to establish a trend.
Bullish Outlook: If inventory levels continue to decline and macroeconomic data weakens the US dollar, US crude oil has a chance to consolidate above 56.00 and retest the 57.00-58.00 range. Only if 58.00 is broken and held with significant volume will the market potentially shift from a "range-bound rebound" to a "trend correction," opening up more upside potential. At that point, the 60.50 level will become a crucial reference point again.
Bearish Outlook: If supply expectations strengthen further, such as increased pricing of additional supply in the North American market, while demand-side positive factors fail to materialize, prices may repeatedly test the 56.00 level after encountering resistance at 58.00. Once 56.00 is breached, market attention will quickly shift to the previous low of 54.98; if this low is also broken, it signifies a continuation of the downtrend, and the market will move from consolidation to a new round of downward movement.
In summary, US crude oil around $56.80 appears to be in a "recovery phase after a downtrend": fundamentals provide support, but supply narratives limit the upside; technical indicators show clear key price levels and neutral-to-weak momentum. The key short-term focus remains on whether the $57.00 pivot point and the $58.00 resistance level can be effectively broken, and whether the $56.00 support level shows sufficient resilience during pullbacks.
- Risk Warning and Disclaimer
- The market involves risk, and trading may not be suitable for all investors. This article is for reference only and does not constitute personal investment advice, nor does it take into account certain users’ specific investment objectives, financial situation, or other needs. Any investment decisions made based on this information are at your own risk.