Kazakhstan's disturbances combined with strong refined oil prices: What's Brent crude's next move?
2026-01-20 17:56:16
On Tuesday (January 20), Brent crude oil traded around $64.00 per barrel during the European session. The price initially rose rapidly from a low of $58.69, then surged to around $66.79 before falling back, returning to the previous area of high trading volume. The market entered a typical consolidation phase characterized by "uncertain direction but significant volatility": on the one hand, cooling risk appetite suppressed the willingness to chase higher prices; on the other hand, tight signals from the spot market deterred short sellers from increasing their positions.
The current resilience of oil prices stems primarily from two supporting factors. The first is the macro-level pricing mechanism: a weaker dollar typically provides marginal support for dollar-denominated commodities, preventing a simultaneous drop in oil prices when risk appetite weakens. The second is the supply and demand structure: a relatively strong time spread often indicates a tighter spot market and higher value for near-month contracts. This raises the cost of short positions and allows arbitrage and rollover structures to support the market.
Supply-side disruptions are also amplifying the perceived tightness in the spot market. In Kazakhstan, Tengizchevr Oil temporarily halted production at its Tengiz and Korolev oil fields due to a generator fire; the producer's output is estimated at approximately 890,000 barrels per day in the first three quarters of 2025. Recent supply disruptions in the country are not uncommon, including disruptions to shipments via the Caspian Pipeline Union terminal. For crude oil futures, a single event may not necessarily change the medium- to long-term balance sheet, but it will significantly increase the short-term uncertainty premium, especially in regional markets with low inventory or high turnover.
The bright spots on the demand side mainly come from the refined oil product chain. The crack spreads for middle distillates such as diesel have recently strengthened again, returning to near $25/barrel, indicating that refineries' profit structures still have the ability to passively absorb crude oil demand. The EU will implement import restrictions on refined oil products "related to Russian crude oil" on January 21st. Although trade flows have had time to adjust, structural frictions may still cause localized supply mismatches in the short term, especially affecting the marginal pricing of European middle distillates. Some Indian refineries are reportedly adjusting their feedstock procurement structures to maintain compliance and stability in sales to Europe. These factors combined mean that crude oil is not simply fluctuating according to risk appetite, but rather is being pulled between "macroeconomic pressures" and a "tight spot market balance."
The daily candlestick chart shows that the price retreated after reaching a high of $66.79, consolidating around $64.00. Two key levels are clearly visible on the chart: the area around $65.00 forms a short-term resistance zone, while the $65.04 level, previously a significant resistance point, represents a confluence of previous highs and psychological barriers; the $63.30 level forms a support level, serving as both a potential retest point during pullbacks and a risk line at the lower edge of the consolidation range. If the price maintains a sideways trend above $63.30, the structure resembles a "consolidation after an uptrend," and bullish sentiment could continue. Conversely, a decisive break below $63.30 would trigger a deeper pullback from the rapid rise from $58.69, potentially reconfirming a downtrend from consolidation.
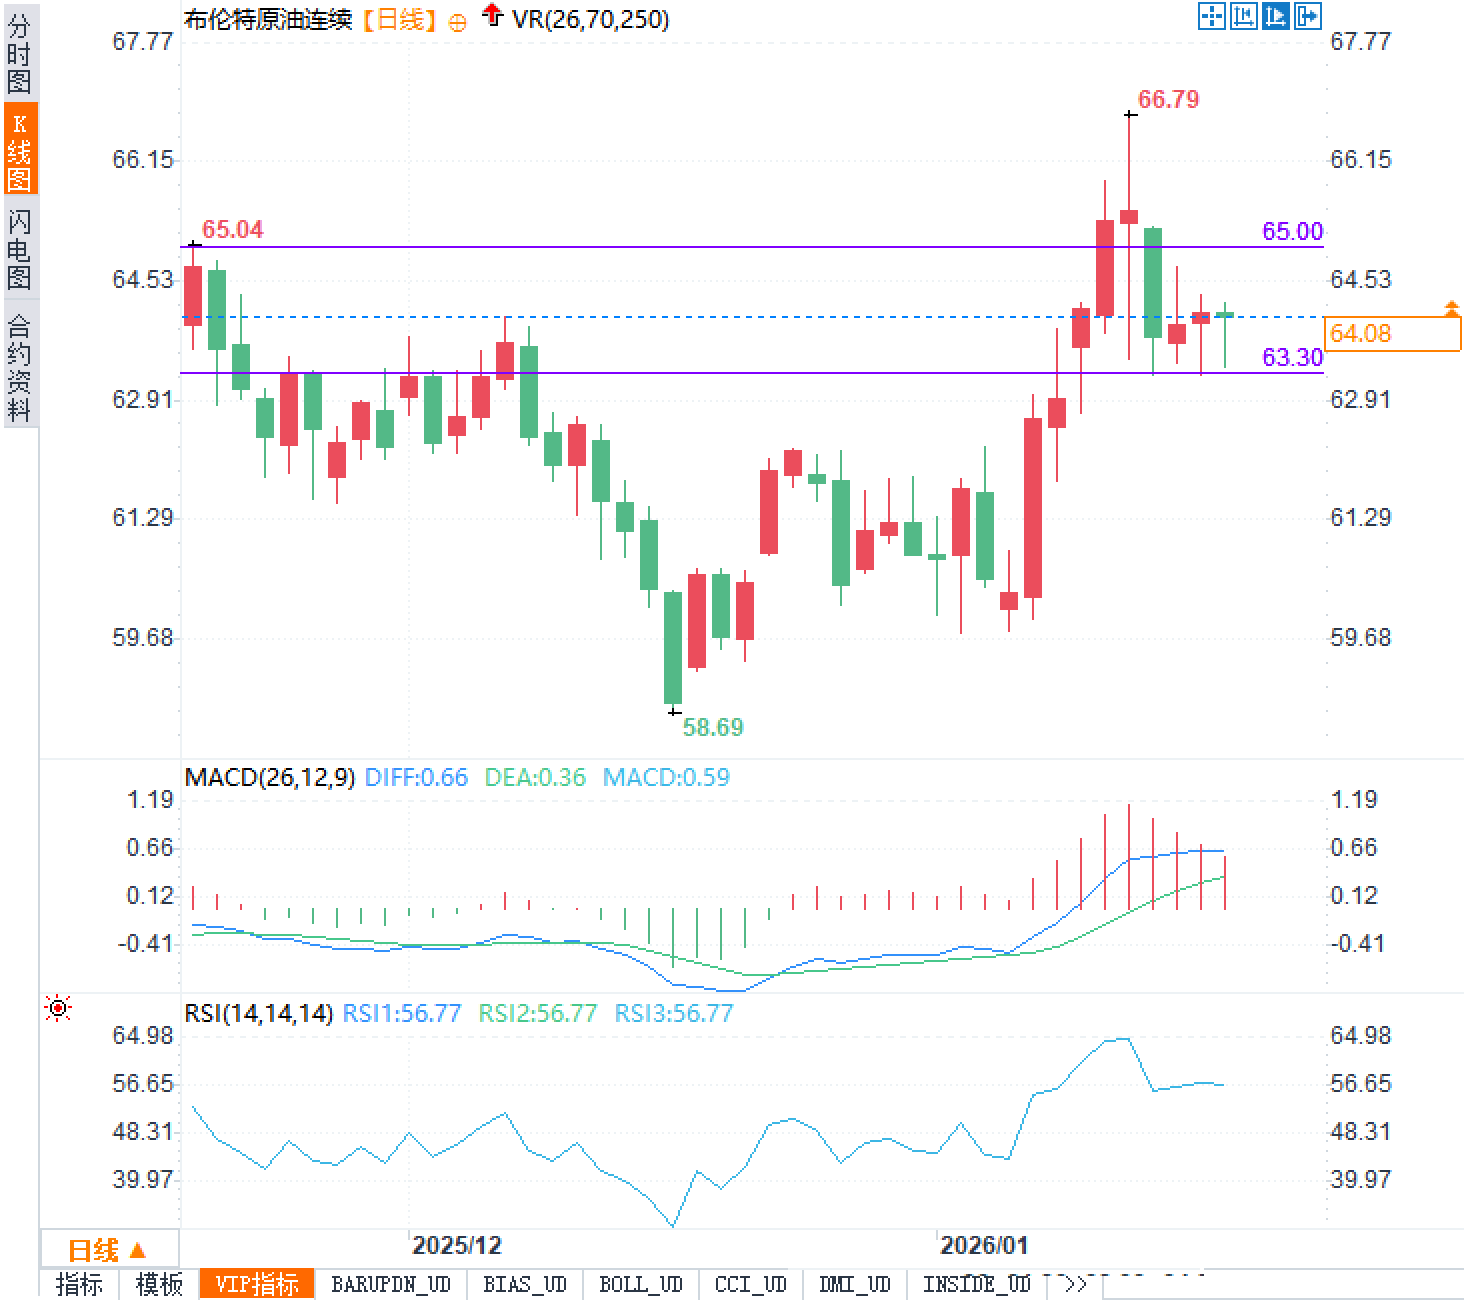
At the indicator level, the MACD shows that the DIFF is 0.66, the DEA is 0.36, and the MACD is 0.59, all above the zero axis and the histogram is still positive, indicating that the medium-term momentum is still relatively strong. However, the "high-low" indicates that the momentum has been released and the market has entered a digestion phase. The subsequent trend will depend on whether the signal line and histogram continue to converge to determine whether the bulls are exhausted. The RSI (14) reading is 56.77, which is in the neutral to strong range. It is neither overbought nor oversold, which is consistent with the typical characteristics of "trend rising and then entering consolidation": the price needs time to exchange for space, digesting the previous gains through volume contraction or range oscillation. In summary, the area between $65.00 and $63.30 is more like a short-term box. Whether the upper edge of the box can be effectively broken will determine whether $66.79 will be retested. If the lower edge of the box is lost, we need to be wary of the tail risk of "retracement" turning into "reversal".
From a sentiment perspective, crude oil's current sentiment is not one-sided and uniform, but rather a layered consensus: short-term traders are more focused on the increased volatility and reduced positions resulting from cooling risk appetite, tending to trade within a range at key price levels; medium-term funds are more concerned about the "tight spot market" implied by strong time spreads and rising refined oil cracking rates, thus viewing pullbacks as retracements rather than collapses. These two forces are mutually restraining, resulting in a tug-of-war in the market, with "limited downside and limited upside."
At this juncture, the most likely scenario is a false breakout around key levels: a surge to $65.00 without sustained upward momentum could easily trigger a bull trap followed by a pullback; a dip to $63.30 followed by a rapid rebound could also create a bear trap and short-term squeeze. Sentiment is not extreme; rather, it seems to be awaiting the next stronger driver: either more continuous supply-side disruptions, further strengthening of refinery profits in the refined oil supply chain, or a clearer trendline from the US dollar.
Fundamentals
The current resilience of oil prices stems primarily from two supporting factors. The first is the macro-level pricing mechanism: a weaker dollar typically provides marginal support for dollar-denominated commodities, preventing a simultaneous drop in oil prices when risk appetite weakens. The second is the supply and demand structure: a relatively strong time spread often indicates a tighter spot market and higher value for near-month contracts. This raises the cost of short positions and allows arbitrage and rollover structures to support the market.
Supply-side disruptions are also amplifying the perceived tightness in the spot market. In Kazakhstan, Tengizchevr Oil temporarily halted production at its Tengiz and Korolev oil fields due to a generator fire; the producer's output is estimated at approximately 890,000 barrels per day in the first three quarters of 2025. Recent supply disruptions in the country are not uncommon, including disruptions to shipments via the Caspian Pipeline Union terminal. For crude oil futures, a single event may not necessarily change the medium- to long-term balance sheet, but it will significantly increase the short-term uncertainty premium, especially in regional markets with low inventory or high turnover.
The bright spots on the demand side mainly come from the refined oil product chain. The crack spreads for middle distillates such as diesel have recently strengthened again, returning to near $25/barrel, indicating that refineries' profit structures still have the ability to passively absorb crude oil demand. The EU will implement import restrictions on refined oil products "related to Russian crude oil" on January 21st. Although trade flows have had time to adjust, structural frictions may still cause localized supply mismatches in the short term, especially affecting the marginal pricing of European middle distillates. Some Indian refineries are reportedly adjusting their feedstock procurement structures to maintain compliance and stability in sales to Europe. These factors combined mean that crude oil is not simply fluctuating according to risk appetite, but rather is being pulled between "macroeconomic pressures" and a "tight spot market balance."
Technical aspects:
The daily candlestick chart shows that the price retreated after reaching a high of $66.79, consolidating around $64.00. Two key levels are clearly visible on the chart: the area around $65.00 forms a short-term resistance zone, while the $65.04 level, previously a significant resistance point, represents a confluence of previous highs and psychological barriers; the $63.30 level forms a support level, serving as both a potential retest point during pullbacks and a risk line at the lower edge of the consolidation range. If the price maintains a sideways trend above $63.30, the structure resembles a "consolidation after an uptrend," and bullish sentiment could continue. Conversely, a decisive break below $63.30 would trigger a deeper pullback from the rapid rise from $58.69, potentially reconfirming a downtrend from consolidation.
At the indicator level, the MACD shows that the DIFF is 0.66, the DEA is 0.36, and the MACD is 0.59, all above the zero axis and the histogram is still positive, indicating that the medium-term momentum is still relatively strong. However, the "high-low" indicates that the momentum has been released and the market has entered a digestion phase. The subsequent trend will depend on whether the signal line and histogram continue to converge to determine whether the bulls are exhausted. The RSI (14) reading is 56.77, which is in the neutral to strong range. It is neither overbought nor oversold, which is consistent with the typical characteristics of "trend rising and then entering consolidation": the price needs time to exchange for space, digesting the previous gains through volume contraction or range oscillation. In summary, the area between $65.00 and $63.30 is more like a short-term box. Whether the upper edge of the box can be effectively broken will determine whether $66.79 will be retested. If the lower edge of the box is lost, we need to be wary of the tail risk of "retracement" turning into "reversal".
Market Sentiment Observation
From a sentiment perspective, crude oil's current sentiment is not one-sided and uniform, but rather a layered consensus: short-term traders are more focused on the increased volatility and reduced positions resulting from cooling risk appetite, tending to trade within a range at key price levels; medium-term funds are more concerned about the "tight spot market" implied by strong time spreads and rising refined oil cracking rates, thus viewing pullbacks as retracements rather than collapses. These two forces are mutually restraining, resulting in a tug-of-war in the market, with "limited downside and limited upside."
At this juncture, the most likely scenario is a false breakout around key levels: a surge to $65.00 without sustained upward momentum could easily trigger a bull trap followed by a pullback; a dip to $63.30 followed by a rapid rebound could also create a bear trap and short-term squeeze. Sentiment is not extreme; rather, it seems to be awaiting the next stronger driver: either more continuous supply-side disruptions, further strengthening of refinery profits in the refined oil supply chain, or a clearer trendline from the US dollar.
- Risk Warning and Disclaimer
- The market involves risk, and trading may not be suitable for all investors. This article is for reference only and does not constitute personal investment advice, nor does it take into account certain users’ specific investment objectives, financial situation, or other needs. Any investment decisions made based on this information are at your own risk.