After the record-breaking auction, will US Treasury bonds "support" or "undermine" gold?
2026-01-22 20:21:32
On Thursday (January 22), after the previous day's sharp fluctuations, the market's core driving force shifted from the shock of the sudden "tariff remarks" to the assessment of macroeconomic data and central bank policy paths. The US Treasury market showed a clear "bull market flattening" trend, with long-term yields falling significantly from their highs; the US dollar index returned to near-flat levels after a brief rebound; spot gold, after hitting a record high, came under pressure due to a temporary stabilization in risk sentiment and entered a consolidation phase at high levels. In the next two to three trading days, market focus will be on a series of key US economic data to be released, particularly the Fed's preferred inflation indicator—Personal Consumption Expenditures (PCE) data. Its performance will directly affect market expectations for interest rate paths, and consequently, the short-term trends of dollar-denominated assets and safe-haven assets.

The core factors driving recent volatility in the US Treasury market have expanded from simple economic data to global safe-haven demand triggered by geopolitical risks and fiscal concerns in major economies. On Wednesday, as tensions over Greenland eased, market risk aversion subsided somewhat, but this did not completely reverse the rebound in US Treasuries. A key driver was the strong demand in the Treasury auction market. Wednesday's $13 billion 20-year Treasury auction yielded exceptionally strong results, with the final yield ($4.846%) one basis point lower than the pre-auction market yield (a "screen-through"), demonstrating robust demand from end-investors (both indirect and direct bidders). The combined allocation rate reached 93.8%, the highest level since June 2024, while the allocation rate for dealers was compressed to a low of 6.2%. The bid-to-cover ratio of 2.86 also far exceeded the recent average. This result clearly demonstrates that in a global environment of uncertainty, the long-term asset attributes of US Treasuries remain attractive to international capital, effectively hedging against potential selling pressure from improved short-term risk sentiment.
From a technical perspective, the 10-year US Treasury yield on the 240-minute candlestick chart surged to a high of 4.301% on January 21st, but quickly retreated, reaching a local low of 4.247% driven by a strong auction, before finally closing at 4.257%. Currently, the yield is trading near the middle Bollinger Band (20,2) at 4.258, with the upper and lower bands at 4.305 and 4.211 respectively. Although the MACD indicator remains below the zero line, the DIFF line shows signs of crossing above the DEA line to form a golden cross, and the green bars have shortened, indicating that the short-term downward momentum is weakening. Market analysts believe the tactical bias is neutral, favoring two-way trading within the new range, but a rebound to the 4.35% area would present a good buying opportunity. Considering both fundamentals and technicals, the core trading range for the 10-year US Treasury yield is expected to shift downward to 4.28%-4.24% in the next 2-3 trading days. If the PCE data is moderate, yields may test the lower end of the range or even lower; conversely, if the data is stronger than expected, it may test the resistance near 4.30%. During the trading session, close attention should be paid to the initial jobless claims, the revised Q3 GDP figure, and the PCE data to be released on Thursday, as well as the results of the 10-year Treasury Inflation-Protected Securities (TIPS) auction held on the same day.

The short-term trend of the US dollar index is closely linked to the US Treasury market, primarily driven by a transmission chain of "risk aversion - US Treasury demand - dollar liquidity." Previous market turmoil triggered by "tariff rhetoric" gave rise to the so-called "sell America" narrative, reflecting market concerns about potential European capital outflows from dollar assets. However, several market strategists point out that there is no conclusive evidence of a systemic capital outflow. Recent volatility is largely due to increased risk management and hedging activities, stemming from a normal recovery following the extremely low volatility environment at the end of last year. With the easing of geopolitical tensions, the dollar's pricing logic has quickly returned to traditional drivers: the economic growth gap between the US and other major economies, and the difference in monetary policy expectations.
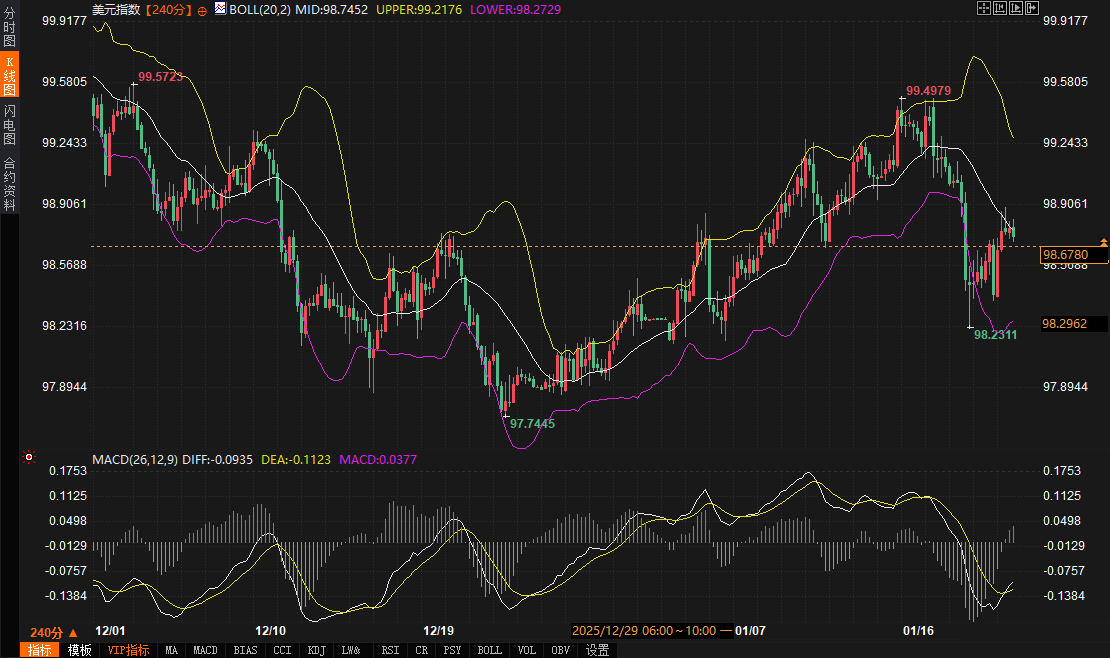
From a technical perspective, the US dollar index has returned to calm after a brief rebound. The 240-minute chart shows the index currently trading around 98.75, slightly above the Bollinger Band middle line at 98.7453. The MACD indicator is below the zero line, with the DIFF and DEA lines converging, indicating a temporary balance between bullish and bearish forces. Key resistance lies near the previous high of 99.5723, while support is seen at the recent low of 98.2311. Market sentiment suggests that from a European perspective, it is premature to celebrate the easing of tensions, as the specific framework for an agreement on the Greenland issue remains unknown. The market is likely to refocus on central bank policies and interest rate differentials after a brief period of volatility.
Looking ahead to the next few days, the US dollar's performance will be more directly influenced by US economic data, particularly inflation data. If the PCE data reinforces market expectations that the Federal Reserve will keep interest rates high for a longer period, it could provide support for the dollar. Conversely, if the data points to a continued slowdown in inflation, it could weaken the dollar's relative advantage. The dollar index is expected to fluctuate between 98.20 and 99.00 over the next 2-3 days. A break below 98.20 could lead to further declines; a break above 99.00 could test the 99.30-99.50 area. In addition to the PCE data, attention should also be paid to developments in the Eurozone and Japan, especially the potential hawkish signals from the Bank of Japan's policy meeting, which will directly impact the USD/JPY exchange rate and consequently affect the dollar index.
Gold prices retreated on Thursday after hitting a record high of $4,887.82 per ounce on Wednesday. This pullback was primarily driven by two short-term factors: firstly, the rebound in risk assets temporarily diverted safe-haven demand; and secondly, a slight recovery in the US dollar put technical pressure on dollar-denominated gold. However, this did not alter the strong upward trend gold has maintained since the end of November. The core driver of this rally has been the ongoing global geopolitical tensions (including the Russia-Ukraine conflict) and market concerns about the policy independence of major central banks, particularly the Federal Reserve. These structural factors have provided solid safe-haven buying support for gold.
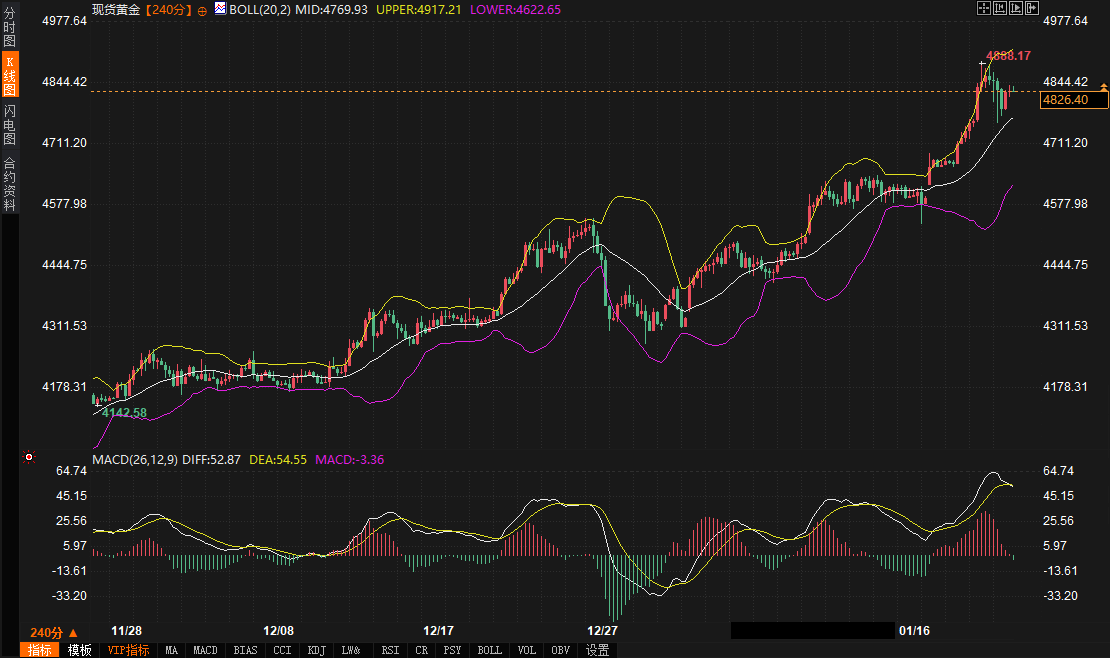
Technical analysis shows that spot gold, on the 240-minute candlestick chart, has risen from approximately $4178 to above $4800. The current price is around $4825, with a recent high of $4888.17. Gold prices continue to trade above the Bollinger Band middle line ($4769.89), indicating a continued bullish trend. In the MACD indicator, the DIFF and DEA lines are running high above the zero line; although some green bars appeared, they have recently shown signs of turning red and expanding, suggesting that bullish momentum may be rebuilding. Several technical support levels marked on the chart, such as the Bollinger Band middle line and the previous consolidation platform, form a buffer zone for gold price pullbacks.
Professional institutions' views also confirm the market's optimistic sentiment. Analysts point out that the overall upward trend in gold prices remains intact, and in the short term, it may even reach the $5000-$5200 range. This reflects the market's long-term confidence in gold as the ultimate safe-haven asset and a tool for hedging against future uncertainties. In the next 2-3 days, gold prices are expected to consolidate at high levels to digest the recent significant gains. The key technical support zone is between $4780 and $4750 (Bollinger Band middle line and previous platform). If this area holds, the market may challenge historical highs again or even higher. Initial resistance is in the $4880-$4900 area, with stronger resistance around the upper Bollinger Band at $4917. During the trading session, the impact of US PCE data on real interest rate expectations needs close attention. Any signal reinforcing the "higher and longer" interest rate stance may suppress gold prices in the short term, while weak data could quickly ignite new buying. At the same time, any new developments in geopolitics need to be continuously monitored, as this remains a key variable triggering safe-haven buying in gold.
In summary, the market will be in a transitional observation period over the next two to three trading days, shifting from event-driven to data-driven approaches. The trend of US Treasury yields will be a key pivot, directly impacting the attractiveness of dollar assets and the level of global risk aversion. Strong demand at Treasury auctions has provided a temporary bottom for US Treasuries, but whether yields can decline further depends on economic data confirming controlled inflation and a moderately cooling economic trend. The US dollar index is expected to maintain a range-bound trading pattern, awaiting data to indicate direction. After reaching a record high, spot gold technically needs consolidation, but the foundation of its long-term upward trend—geopolitical risks and macroeconomic uncertainties—has not disappeared. Any significant pullback could attract medium- to long-term investment funds.
Thursday's flurry of economic data releases, particularly the core PCE inflation data, will be a litmus test for the market's short-term direction. Data that meets or falls short of expectations could reinforce the "bull market flattening" trade, suppressing the dollar and providing upward momentum for gold. Conversely, unexpectedly strong data could temporarily reverse risk sentiment, pushing up US Treasury yields and the dollar, putting downward pressure on gold prices. Furthermore, the Bank of Japan's policy moves should not be overlooked; any unexpectedly hawkish statements could trigger a chain reaction in global bond and currency markets.
US Treasuries: Safe-haven demand and strong auctions contribute to a "bull market flattening," with yields expected to shift downwards.
The core factors driving recent volatility in the US Treasury market have expanded from simple economic data to global safe-haven demand triggered by geopolitical risks and fiscal concerns in major economies. On Wednesday, as tensions over Greenland eased, market risk aversion subsided somewhat, but this did not completely reverse the rebound in US Treasuries. A key driver was the strong demand in the Treasury auction market. Wednesday's $13 billion 20-year Treasury auction yielded exceptionally strong results, with the final yield ($4.846%) one basis point lower than the pre-auction market yield (a "screen-through"), demonstrating robust demand from end-investors (both indirect and direct bidders). The combined allocation rate reached 93.8%, the highest level since June 2024, while the allocation rate for dealers was compressed to a low of 6.2%. The bid-to-cover ratio of 2.86 also far exceeded the recent average. This result clearly demonstrates that in a global environment of uncertainty, the long-term asset attributes of US Treasuries remain attractive to international capital, effectively hedging against potential selling pressure from improved short-term risk sentiment.
From a technical perspective, the 10-year US Treasury yield on the 240-minute candlestick chart surged to a high of 4.301% on January 21st, but quickly retreated, reaching a local low of 4.247% driven by a strong auction, before finally closing at 4.257%. Currently, the yield is trading near the middle Bollinger Band (20,2) at 4.258, with the upper and lower bands at 4.305 and 4.211 respectively. Although the MACD indicator remains below the zero line, the DIFF line shows signs of crossing above the DEA line to form a golden cross, and the green bars have shortened, indicating that the short-term downward momentum is weakening. Market analysts believe the tactical bias is neutral, favoring two-way trading within the new range, but a rebound to the 4.35% area would present a good buying opportunity. Considering both fundamentals and technicals, the core trading range for the 10-year US Treasury yield is expected to shift downward to 4.28%-4.24% in the next 2-3 trading days. If the PCE data is moderate, yields may test the lower end of the range or even lower; conversely, if the data is stronger than expected, it may test the resistance near 4.30%. During the trading session, close attention should be paid to the initial jobless claims, the revised Q3 GDP figure, and the PCE data to be released on Thursday, as well as the results of the 10-year Treasury Inflation-Protected Securities (TIPS) auction held on the same day.
US Dollar Index: Geopolitical risk premium recedes, economic data and interest rate differentials return to driving growth.
The short-term trend of the US dollar index is closely linked to the US Treasury market, primarily driven by a transmission chain of "risk aversion - US Treasury demand - dollar liquidity." Previous market turmoil triggered by "tariff rhetoric" gave rise to the so-called "sell America" narrative, reflecting market concerns about potential European capital outflows from dollar assets. However, several market strategists point out that there is no conclusive evidence of a systemic capital outflow. Recent volatility is largely due to increased risk management and hedging activities, stemming from a normal recovery following the extremely low volatility environment at the end of last year. With the easing of geopolitical tensions, the dollar's pricing logic has quickly returned to traditional drivers: the economic growth gap between the US and other major economies, and the difference in monetary policy expectations.
From a technical perspective, the US dollar index has returned to calm after a brief rebound. The 240-minute chart shows the index currently trading around 98.75, slightly above the Bollinger Band middle line at 98.7453. The MACD indicator is below the zero line, with the DIFF and DEA lines converging, indicating a temporary balance between bullish and bearish forces. Key resistance lies near the previous high of 99.5723, while support is seen at the recent low of 98.2311. Market sentiment suggests that from a European perspective, it is premature to celebrate the easing of tensions, as the specific framework for an agreement on the Greenland issue remains unknown. The market is likely to refocus on central bank policies and interest rate differentials after a brief period of volatility.
Looking ahead to the next few days, the US dollar's performance will be more directly influenced by US economic data, particularly inflation data. If the PCE data reinforces market expectations that the Federal Reserve will keep interest rates high for a longer period, it could provide support for the dollar. Conversely, if the data points to a continued slowdown in inflation, it could weaken the dollar's relative advantage. The dollar index is expected to fluctuate between 98.20 and 99.00 over the next 2-3 days. A break below 98.20 could lead to further declines; a break above 99.00 could test the 99.30-99.50 area. In addition to the PCE data, attention should also be paid to developments in the Eurozone and Japan, especially the potential hawkish signals from the Bank of Japan's policy meeting, which will directly impact the USD/JPY exchange rate and consequently affect the dollar index.
Spot gold: Consolidating near historical highs, its safe-haven foundation remains unshaken.
Gold prices retreated on Thursday after hitting a record high of $4,887.82 per ounce on Wednesday. This pullback was primarily driven by two short-term factors: firstly, the rebound in risk assets temporarily diverted safe-haven demand; and secondly, a slight recovery in the US dollar put technical pressure on dollar-denominated gold. However, this did not alter the strong upward trend gold has maintained since the end of November. The core driver of this rally has been the ongoing global geopolitical tensions (including the Russia-Ukraine conflict) and market concerns about the policy independence of major central banks, particularly the Federal Reserve. These structural factors have provided solid safe-haven buying support for gold.
Technical analysis shows that spot gold, on the 240-minute candlestick chart, has risen from approximately $4178 to above $4800. The current price is around $4825, with a recent high of $4888.17. Gold prices continue to trade above the Bollinger Band middle line ($4769.89), indicating a continued bullish trend. In the MACD indicator, the DIFF and DEA lines are running high above the zero line; although some green bars appeared, they have recently shown signs of turning red and expanding, suggesting that bullish momentum may be rebuilding. Several technical support levels marked on the chart, such as the Bollinger Band middle line and the previous consolidation platform, form a buffer zone for gold price pullbacks.
Professional institutions' views also confirm the market's optimistic sentiment. Analysts point out that the overall upward trend in gold prices remains intact, and in the short term, it may even reach the $5000-$5200 range. This reflects the market's long-term confidence in gold as the ultimate safe-haven asset and a tool for hedging against future uncertainties. In the next 2-3 days, gold prices are expected to consolidate at high levels to digest the recent significant gains. The key technical support zone is between $4780 and $4750 (Bollinger Band middle line and previous platform). If this area holds, the market may challenge historical highs again or even higher. Initial resistance is in the $4880-$4900 area, with stronger resistance around the upper Bollinger Band at $4917. During the trading session, the impact of US PCE data on real interest rate expectations needs close attention. Any signal reinforcing the "higher and longer" interest rate stance may suppress gold prices in the short term, while weak data could quickly ignite new buying. At the same time, any new developments in geopolitics need to be continuously monitored, as this remains a key variable triggering safe-haven buying in gold.
Future Trend Outlook
In summary, the market will be in a transitional observation period over the next two to three trading days, shifting from event-driven to data-driven approaches. The trend of US Treasury yields will be a key pivot, directly impacting the attractiveness of dollar assets and the level of global risk aversion. Strong demand at Treasury auctions has provided a temporary bottom for US Treasuries, but whether yields can decline further depends on economic data confirming controlled inflation and a moderately cooling economic trend. The US dollar index is expected to maintain a range-bound trading pattern, awaiting data to indicate direction. After reaching a record high, spot gold technically needs consolidation, but the foundation of its long-term upward trend—geopolitical risks and macroeconomic uncertainties—has not disappeared. Any significant pullback could attract medium- to long-term investment funds.
Thursday's flurry of economic data releases, particularly the core PCE inflation data, will be a litmus test for the market's short-term direction. Data that meets or falls short of expectations could reinforce the "bull market flattening" trade, suppressing the dollar and providing upward momentum for gold. Conversely, unexpectedly strong data could temporarily reverse risk sentiment, pushing up US Treasury yields and the dollar, putting downward pressure on gold prices. Furthermore, the Bank of Japan's policy moves should not be overlooked; any unexpectedly hawkish statements could trigger a chain reaction in global bond and currency markets.
- Risk Warning and Disclaimer
- The market involves risk, and trading may not be suitable for all investors. This article is for reference only and does not constitute personal investment advice, nor does it take into account certain users’ specific investment objectives, financial situation, or other needs. Any investment decisions made based on this information are at your own risk.