Gold rebounded and stabilized above the $4,800 mark, forming a descending triangle pattern in the short term.
2026-02-06 18:26:31
Last week, gold experienced a historic rally, but encountered heavy selling pressure at the psychological level of $5,600.

Driven by bargain hunting, gold prices rebounded from a low of $5,100, but the rebound was short-lived. Investors who had previously taken long positions took profits before the rebound reached the $5,500 mark, which led to a sharp drop in gold prices on Friday, recording a historic decline. Prices fell all the way to $4,700 before rebounding before the close of trading at the end of the weekend.
This downward pressure continued into Sunday's opening, with profit-taking dominating market trading and gold prices falling sharply again, briefly dipping below the $4,500 mark.
However, the bulls then began to exert their strength; after the sharp drop at the opening on Sunday night, gold prices successively reached higher highs and lower lows. Yesterday, gold prices once again stood above the key psychological level of $5,000, but it was at this level that the bulls began to encounter pressure, and the short-term chart has now formed a bearish descending triangle pattern.
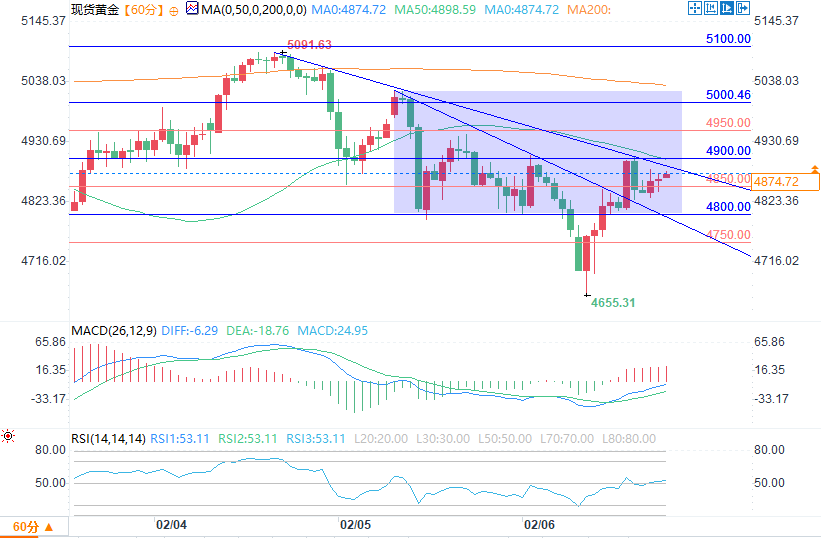
(Gold 1-hour chart source: FX678)
Gold Price Outlook
The current gold market is characterized by significant divergence between bulls and bears: the short-term bearish pattern stands in stark contrast to the strong bullish trend that propelled gold prices higher last week. While this technical pattern may indicate a deep correction within the larger bullish trend, it's important to note that the core logic driving last week's price increases remains fundamentally unchanged.
From a fundamental perspective, the statements by US Treasury Secretary Bessant and National Economic Council Director Hassett in support of a strong dollar became the most prominent variable this week. Last week's correlation between weaker gold prices and a stronger dollar was a direct response to these official statements; the high-profile promotion of a strong dollar by top US officials naturally became a reasonable incentive for investors to take profits and temporarily halt the previous one-sided upward trend in gold.
The core question in the market right now is: will this pullback trigger more profit-taking, or will it present an opportunity for bulls to buy on dips? After all, just over a week ago, investors were actively buying at high levels of $5300 and $5400, and now, a week later, they have the opportunity to buy gold below $5000. In my view, both the bulls and bears currently have sound rationale for their positions.
However, for developing trading strategies, purely fundamental analysis offers little practical value; at this point, the guidance of technical analysis and market structure becomes crucial. Currently, gold prices are still closely aligned with key psychological levels, with the support level of the aforementioned descending triangle pattern falling at $4800. Previously, before testing the $5000 level, gold prices found support at $4900, and the bulls ultimately encountered resistance and retreated at this key psychological level.
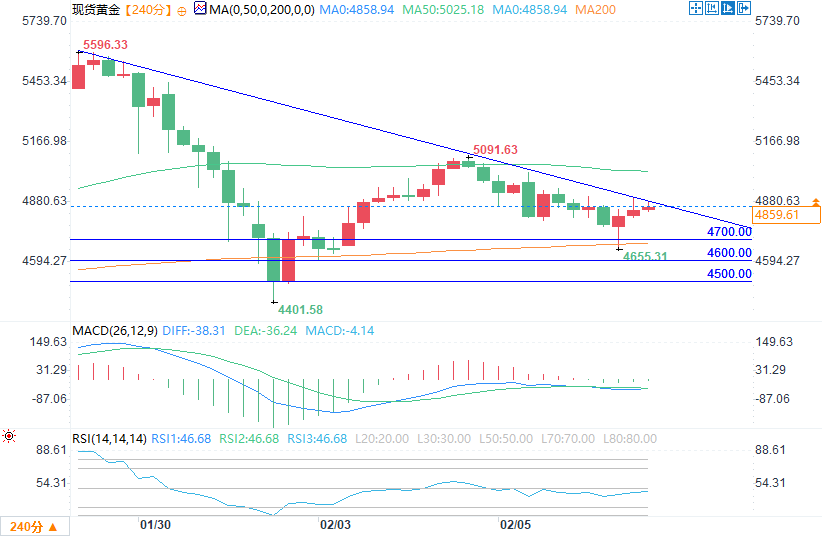
(4-hour chart of spot gold source: EasyForex)
Therefore, I believe the strategy should follow the current established market structure: If gold prices weaken, the $4600 and $4500 levels that provided support earlier this week will become key downside support levels; $4700 is also a level worth watching. If gold prices test this level and buying pressure returns, it may form a higher low than at the beginning of the week, further solidifying the support structure. If gold prices break upwards and reach $4941, the descending triangle pattern will be invalidated, and gold prices will likely retest the $5000 level. After breaking through, the next key resistance level will move up to $5100; if $5100 is broken, gold prices will form a higher short-term high, opening up space for further upward movement by the bulls.
Driven by bargain hunting, gold prices rebounded from a low of $5,100, but the rebound was short-lived. Investors who had previously taken long positions took profits before the rebound reached the $5,500 mark, which led to a sharp drop in gold prices on Friday, recording a historic decline. Prices fell all the way to $4,700 before rebounding before the close of trading at the end of the weekend.
This downward pressure continued into Sunday's opening, with profit-taking dominating market trading and gold prices falling sharply again, briefly dipping below the $4,500 mark.
However, the bulls then began to exert their strength; after the sharp drop at the opening on Sunday night, gold prices successively reached higher highs and lower lows. Yesterday, gold prices once again stood above the key psychological level of $5,000, but it was at this level that the bulls began to encounter pressure, and the short-term chart has now formed a bearish descending triangle pattern.
(Gold 1-hour chart source: FX678)
Gold Price Outlook
The current gold market is characterized by significant divergence between bulls and bears: the short-term bearish pattern stands in stark contrast to the strong bullish trend that propelled gold prices higher last week. While this technical pattern may indicate a deep correction within the larger bullish trend, it's important to note that the core logic driving last week's price increases remains fundamentally unchanged.
From a fundamental perspective, the statements by US Treasury Secretary Bessant and National Economic Council Director Hassett in support of a strong dollar became the most prominent variable this week. Last week's correlation between weaker gold prices and a stronger dollar was a direct response to these official statements; the high-profile promotion of a strong dollar by top US officials naturally became a reasonable incentive for investors to take profits and temporarily halt the previous one-sided upward trend in gold.
The core question in the market right now is: will this pullback trigger more profit-taking, or will it present an opportunity for bulls to buy on dips? After all, just over a week ago, investors were actively buying at high levels of $5300 and $5400, and now, a week later, they have the opportunity to buy gold below $5000. In my view, both the bulls and bears currently have sound rationale for their positions.
However, for developing trading strategies, purely fundamental analysis offers little practical value; at this point, the guidance of technical analysis and market structure becomes crucial. Currently, gold prices are still closely aligned with key psychological levels, with the support level of the aforementioned descending triangle pattern falling at $4800. Previously, before testing the $5000 level, gold prices found support at $4900, and the bulls ultimately encountered resistance and retreated at this key psychological level.
(4-hour chart of spot gold source: EasyForex)
Therefore, I believe the strategy should follow the current established market structure: If gold prices weaken, the $4600 and $4500 levels that provided support earlier this week will become key downside support levels; $4700 is also a level worth watching. If gold prices test this level and buying pressure returns, it may form a higher low than at the beginning of the week, further solidifying the support structure. If gold prices break upwards and reach $4941, the descending triangle pattern will be invalidated, and gold prices will likely retest the $5000 level. After breaking through, the next key resistance level will move up to $5100; if $5100 is broken, gold prices will form a higher short-term high, opening up space for further upward movement by the bulls.
- Risk Warning and Disclaimer
- The market involves risk, and trading may not be suitable for all investors. This article is for reference only and does not constitute personal investment advice, nor does it take into account certain users’ specific investment objectives, financial situation, or other needs. Any investment decisions made based on this information are at your own risk.