Crude oil analysis: India buys 2 million barrels of Venezuelan oil – is this a sign of a breakthrough?
2026-02-06 20:21:02
As the weekend approaches, sentiment in the international crude oil market is tightening again. On Friday, February 6th, WTI crude oil traded around $63.40 per barrel in pre-market trading, exhibiting a clear range-bound movement. Looking at the 30-minute chart, previous highs reached $63.87 and $64.58, forming a technical upper resistance zone; while during the pullback, it dipped to a low of $62.31, with short-term support appearing around $63.18. This back-and-forth movement indicates that the bulls and bears are currently evenly matched, with neither side able to easily dictate the direction.

Behind this stalemate lies the market awaiting a catalyst sufficient to break the balance. Analysts point out that recent prices are more like "pricing uncertainty" than reflecting fundamental changes in actual supply and demand. Especially during this geopolitically sensitive period, any slight disturbance can trigger rapid fluctuations. For example, news that negotiations between the US and Iran in Oman had been halted caused oil prices to jump; however, the Iranian Foreign Minister quickly clarified that negotiations were still ongoing, and the gains were immediately reversed. This news-driven rollercoaster market perfectly reflects the current trading logic.
It's worth noting that while there's no clear trend, the downside appears to be firmly contained. This is mainly due to the market's proactive hedging against potential risks—as long as the probability of a major agreement in the short term is low, coupled with external concerns about military escalation, investors are more inclined to retain a certain risk premium. In other words, people aren't betting on a conflict breaking out, but rather paying for the possibility of "what if."
Besides geopolitical sentiment, fundamentals also provided a floor for oil prices. Recently, OPEC and its allies maintained their existing production policies as expected, without any additional production increases. This decision was in line with market expectations and effectively curbed the risk of further price declines. The restrained stance on the supply side, coupled with signs of gradual improvement on the demand side, has prevented a loosening of the global crude oil supply and demand balance.
Particularly in Asia, the recovery in refinery utilization rates has boosted import demand, partially offsetting the impact of sluggish growth in other regions. While the overall recovery remains moderate, it has at least temporarily ruled out the extreme scenario of a demand collapse. Against this backdrop, unless there is a sudden and significant increase in OPEC+ production, or the Federal Reserve reaffirms expectations of interest rate hikes leading to a stronger dollar and rising real interest rates, oil prices lack the basis for a sustained and deep decline.
Conversely, if geopolitical tensions fail to ease or even escalate further, the existing supply-demand balance could easily be disrupted. Even with unchanged production, transportation disruptions or soaring insurance costs could be enough to push up oil prices. Therefore, beneath the current seemingly calm market lies hidden potential. Once external shocks subside, prices could quickly break out of the trading range and begin a new round of fluctuations.
More noteworthy is the new trend in supply distribution. A recent report quietly revealed that Reliance Industries, one of India's largest private refineries, has repurchased approximately 2 million barrels of Venezuelan crude oil. This marks the first such purchase by India since the US took over Venezuelan crude oil sales earlier this month. The company last bought oil from Venezuela in mid-2025.
It is understood that Mangalore Refining & Petrochemicals, India's state-owned refinery, is also assessing the feasibility of purchasing Venezuelan crude oil, focusing on commercial terms and freight economics. If more refineries follow suit, the flow of Venezuelan crude oil into Asia is expected to increase in stages, thereby affecting the regional price spread structure and creating new arbitrage opportunities. Although the volume of each purchase is limited, its symbolic significance and the opening of technical pathways may foreshadow subtle adjustments in the future supply landscape.
Returning to the market itself, the technical pattern also points to an unclear short-term direction. The MACD indicator shows a DIFF value of 0.03, a DEA value of 0.12, and a MACD histogram of -0.17, indicating that short-term momentum is declining, and the fast line has entered a correction range near the zero axis. The RSI reading is 43, which is in a neutral to weak position and has not yet entered the oversold or overbought extreme areas, consistent with the typical characteristics of "news-driven" fluctuations.
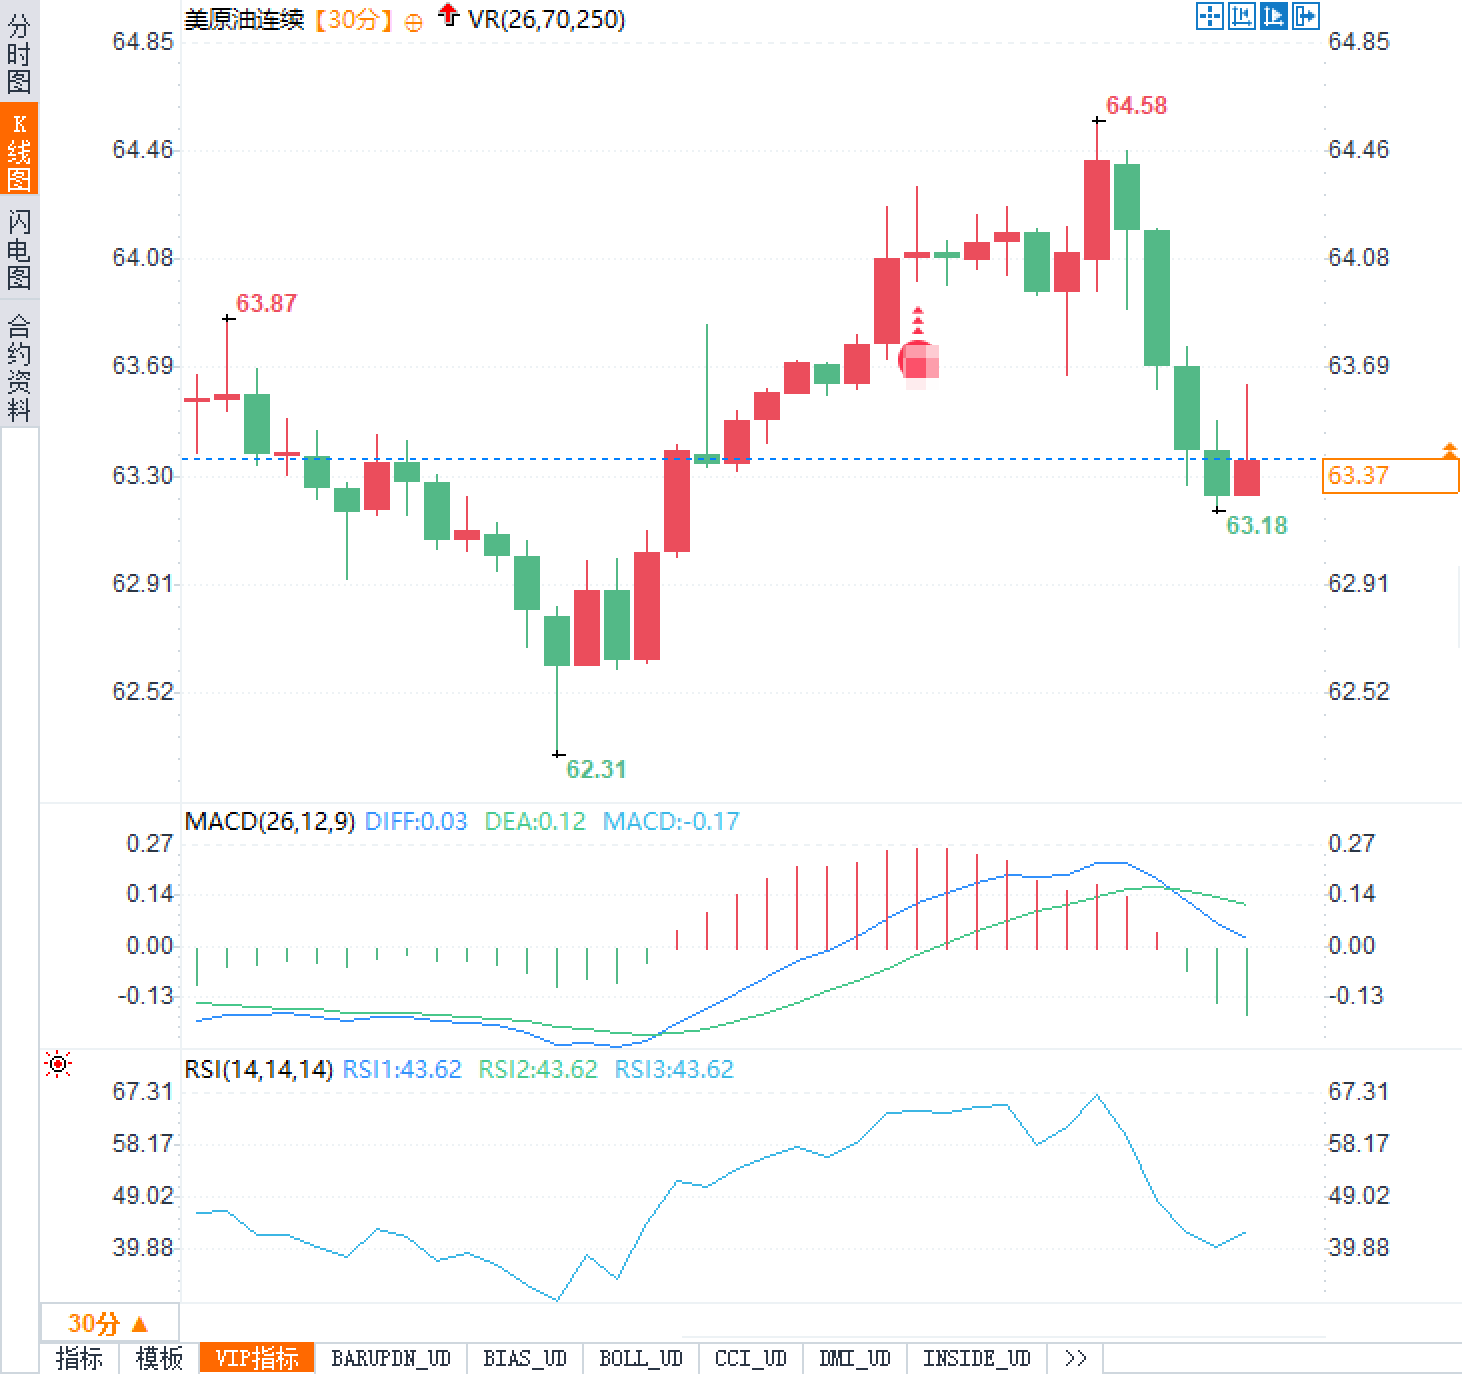
In summary, $64.58 remains a key resistance level, while $62.31 is the recent low support level. If there is substantial progress in the Iran negotiations and market risk premiums decline, oil prices may test the $62 level. Conversely, if there is renewed turmoil before the weekend, or signs of escalating military tensions emerge, prices are more likely to challenge the $64 area.
Behind this stalemate lies the market awaiting a catalyst sufficient to break the balance. Analysts point out that recent prices are more like "pricing uncertainty" than reflecting fundamental changes in actual supply and demand. Especially during this geopolitically sensitive period, any slight disturbance can trigger rapid fluctuations. For example, news that negotiations between the US and Iran in Oman had been halted caused oil prices to jump; however, the Iranian Foreign Minister quickly clarified that negotiations were still ongoing, and the gains were immediately reversed. This news-driven rollercoaster market perfectly reflects the current trading logic.
It's worth noting that while there's no clear trend, the downside appears to be firmly contained. This is mainly due to the market's proactive hedging against potential risks—as long as the probability of a major agreement in the short term is low, coupled with external concerns about military escalation, investors are more inclined to retain a certain risk premium. In other words, people aren't betting on a conflict breaking out, but rather paying for the possibility of "what if."
Stable oil production in oil-producing countries and a recovery in demand provide continued support in the medium term.
Besides geopolitical sentiment, fundamentals also provided a floor for oil prices. Recently, OPEC and its allies maintained their existing production policies as expected, without any additional production increases. This decision was in line with market expectations and effectively curbed the risk of further price declines. The restrained stance on the supply side, coupled with signs of gradual improvement on the demand side, has prevented a loosening of the global crude oil supply and demand balance.
Particularly in Asia, the recovery in refinery utilization rates has boosted import demand, partially offsetting the impact of sluggish growth in other regions. While the overall recovery remains moderate, it has at least temporarily ruled out the extreme scenario of a demand collapse. Against this backdrop, unless there is a sudden and significant increase in OPEC+ production, or the Federal Reserve reaffirms expectations of interest rate hikes leading to a stronger dollar and rising real interest rates, oil prices lack the basis for a sustained and deep decline.
Conversely, if geopolitical tensions fail to ease or even escalate further, the existing supply-demand balance could easily be disrupted. Even with unchanged production, transportation disruptions or soaring insurance costs could be enough to push up oil prices. Therefore, beneath the current seemingly calm market lies hidden potential. Once external shocks subside, prices could quickly break out of the trading range and begin a new round of fluctuations.
Indian refineries quietly place orders for Venezuelan crude oil
More noteworthy is the new trend in supply distribution. A recent report quietly revealed that Reliance Industries, one of India's largest private refineries, has repurchased approximately 2 million barrels of Venezuelan crude oil. This marks the first such purchase by India since the US took over Venezuelan crude oil sales earlier this month. The company last bought oil from Venezuela in mid-2025.
It is understood that Mangalore Refining & Petrochemicals, India's state-owned refinery, is also assessing the feasibility of purchasing Venezuelan crude oil, focusing on commercial terms and freight economics. If more refineries follow suit, the flow of Venezuelan crude oil into Asia is expected to increase in stages, thereby affecting the regional price spread structure and creating new arbitrage opportunities. Although the volume of each purchase is limited, its symbolic significance and the opening of technical pathways may foreshadow subtle adjustments in the future supply landscape.
Technical indicators are showing a weak and volatile trend, with a turning point just around the corner.
Returning to the market itself, the technical pattern also points to an unclear short-term direction. The MACD indicator shows a DIFF value of 0.03, a DEA value of 0.12, and a MACD histogram of -0.17, indicating that short-term momentum is declining, and the fast line has entered a correction range near the zero axis. The RSI reading is 43, which is in a neutral to weak position and has not yet entered the oversold or overbought extreme areas, consistent with the typical characteristics of "news-driven" fluctuations.
In summary, $64.58 remains a key resistance level, while $62.31 is the recent low support level. If there is substantial progress in the Iran negotiations and market risk premiums decline, oil prices may test the $62 level. Conversely, if there is renewed turmoil before the weekend, or signs of escalating military tensions emerge, prices are more likely to challenge the $64 area.
- Risk Warning and Disclaimer
- The market involves risk, and trading may not be suitable for all investors. This article is for reference only and does not constitute personal investment advice, nor does it take into account certain users’ specific investment objectives, financial situation, or other needs. Any investment decisions made based on this information are at your own risk.