Interest rate cut expectations vs. capital outflows! Gold awaits the non-farm payrolls report.
2026-02-09 20:38:58
On Monday (February 9), spot gold opened slightly higher during the Asian and European sessions and then remained in a consolidation phase throughout the day, holding onto all of Friday's gains, which closed up 3.88% on Friday.
The current spot gold market is caught in a balance between bullish and bearish forces, with fundamental support and resistance offsetting each other. Meanwhile, the accelerated deleveraging in the financial sector has further weakened the upward momentum of gold bulls.
Spot gold is currently consolidating above the $5,000 mark, with market traders generally adopting a wait-and-see attitude, awaiting clear direction from core economic data.

The geopolitical situation in the Middle East has become a key turning point for the rebound in gold's safe-haven demand. Although the indirect negotiations between the US and Iran on the Iranian nuclear issue were successfully held and concluded, they ultimately failed to reach an effective consensus on the interests that both countries have always been concerned about, and can only be said to have temporarily eased tensions.
The unusual activity in the Wujiaochang Pizza Index on Saturday and Sunday sparked market speculation, contributing to the surge in gold prices on Friday.
In addition, during this week's window of major US economic data, non-farm payrolls and CPI will be released one after another. However, due to the previous weak employment data, Challenger and job openings data all indicate a weak labor market. At the same time, the University of Michigan's inflation expectations survey shows that the inflation expectation result is 3.5%, which is also lower than the market expectation.
As a result, the market began betting that non-farm payrolls and CPI would show signs of controlled inflation and a weak labor market, which was also an important reason for the surge in the US equity market and the rise in gold prices.
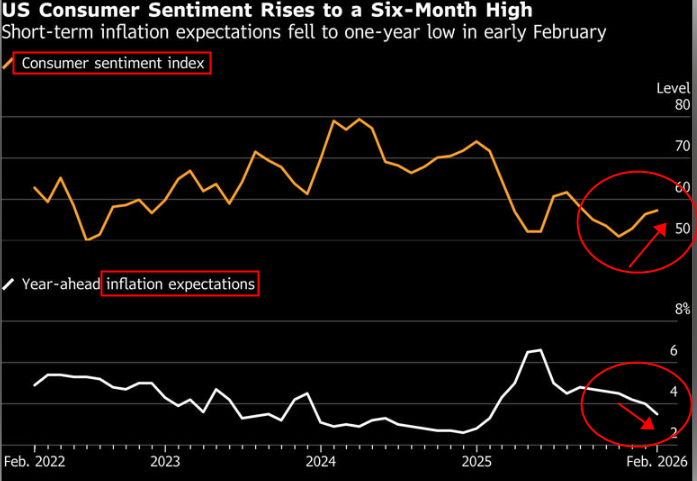
(Trend chart of University of Michigan Consumer Confidence Index and Inflation Expectations Survey)
The delayed non-farm payroll report on Wednesday and the consumer inflation data on Friday will directly anchor market pricing in the Fed's rate cut path, thereby dominating the flow of funds into the dollar index and the price movement of spot gold.
The accelerated deleveraging process in managed funds accounts has led to a significant reduction in net long positions in precious metals, further weakening the financial support for gold and potentially limiting its upward movement. A period of consolidation is needed, awaiting news and data to revitalize the market.
Affected by multiple factors such as rising market volatility, increased exchange margin requirements, and tighter risk value constraints, managed funds accounts had already begun selling on rallies in the previous weeks, and are now further accelerating the pace of deleveraging in order to cope with the complex trading environment.
Looking at the specific positions, long positions in precious metals have all contracted significantly: net long positions in gold have decreased by 22% to 92,072 contracts, the lowest level since October; net long positions in silver have plummeted by 38% to 4,491 contracts, a 23-month low; and platinum positions have decreased by 42% to only 1,083 contracts, with the position status now close to neutral.
The sharp contraction in liquidity has made it difficult for gold bulls to form an effective upward momentum, which is the core reason for the current weakness in gold prices.
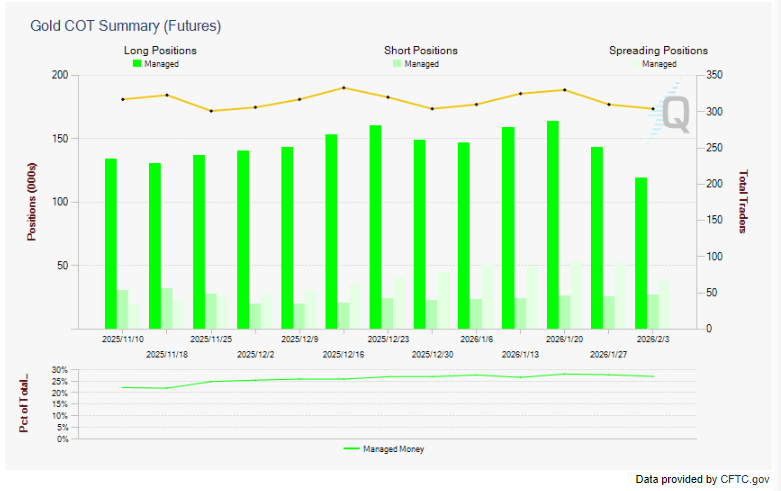
(COT Gold Managed Funds Account Position Trend Chart: Net long positions suffered severe losses after the plunge on February 2nd)
Gold's ability to hold above the $5,000 mark is primarily due to the combined support of the rigid demand from central bank gold purchases and the expectation of a Federal Reserve interest rate cut.
On the one hand, the People's Bank of China's continued gold purchases have become an important support for gold demand. Data released by the central bank shows that it has achieved the fifteenth consecutive month of gold purchases in January. Against the backdrop of fiscal pressure on major economies, the allocation value of gold has become prominent, and the allocation demand remains rigid.
The central bank's gold holdings increased by 40,000 troy ounces that month, reaching a total of 74.19 million troy ounces. Foreign exchange reserves also climbed to US$369.58 billion. The central bank's continued efforts have provided a solid bottom support for gold prices.
On the other hand, rising expectations of a Federal Reserve rate cut, coupled with a weakening dollar, have provided a temporary boost to gold, a non-interest-bearing asset.
Pricing data from the CME FedWatch Tool shows that trading expectations for at least multiple rate cuts by the Federal Reserve in 2026 have further intensified. Meanwhile, last week's U.S. economic data revealed signs of a weakening labor market, which not only confirmed the rationale for further easing of monetary policy by the Fed but also further strengthened market bets on rate cuts.
Meanwhile, statements from senior U.S. officials regarding the nominee for Federal Reserve chairman have exacerbated market concerns about the Fed's policy independence. Coupled with the structural trend of global de-dollarization, this has pushed the dollar index down for two consecutive trading days, moving away from the two-week high reached last Thursday, further amplifying the price support for gold.
Overall, spot gold is currently in a state of mutual support and resistance from fundamentals. The deleveraging of funds has led to a contraction in positions, further amplifying the balance between bulls and bears. In the short term, gold prices are likely to continue to consolidate around the $5,000 mark.
As for the subsequent trend, the direction of gold's breakout will be determined by two key factors: first, the performance of core economic data such as US non-farm payrolls and inflation, which will directly affect the market pricing of the Fed's interest rate cut path, and thus dominate the trend of the dollar and gold.
Secondly, regarding changes in the funding situation, attention should be paid to whether the deleveraging process of the managed funds account has slowed down, as well as the marginal trends in market risk appetite.
Only when the balance of power between buyers and sellers shifts significantly can gold break out of its current sideways trading pattern and achieve a directional breakout.
From a technical perspective, spot gold rebounded to the 0.618 level before its upward momentum slowed. The resistance level is at 5125, which is also the psychological level of 5000 points and the upper rail of the upward channel.
Support levels are at 4940 and below that, around 4860, which corresponds to the blue ascending channel line.
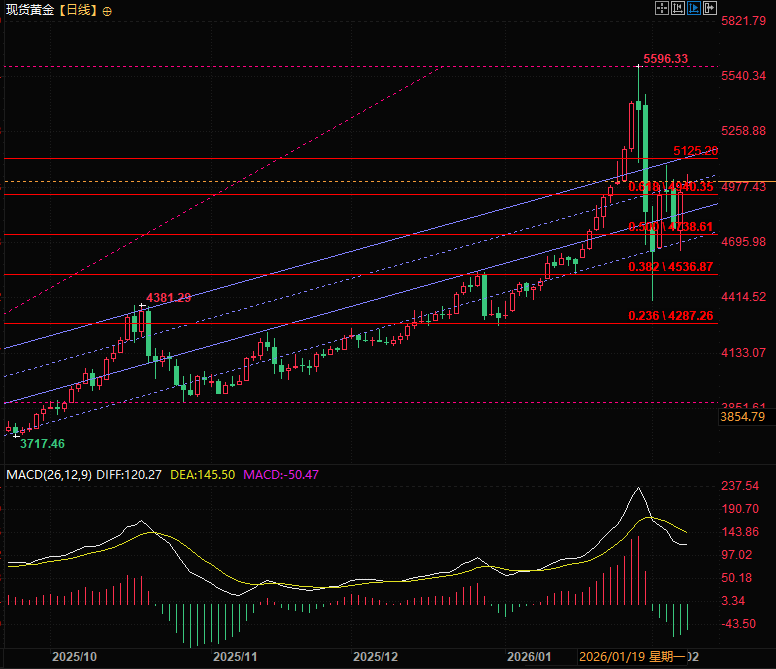
(Spot gold daily chart, source: FX678)
At 20:35 Beijing time, spot gold was trading at $5015.11 per ounce.
The current spot gold market is caught in a balance between bullish and bearish forces, with fundamental support and resistance offsetting each other. Meanwhile, the accelerated deleveraging in the financial sector has further weakened the upward momentum of gold bulls.
Spot gold is currently consolidating above the $5,000 mark, with market traders generally adopting a wait-and-see attitude, awaiting clear direction from core economic data.
Geopolitical uncertainty and data window periods are among the multiple factors driving gold prices higher.
The geopolitical situation in the Middle East has become a key turning point for the rebound in gold's safe-haven demand. Although the indirect negotiations between the US and Iran on the Iranian nuclear issue were successfully held and concluded, they ultimately failed to reach an effective consensus on the interests that both countries have always been concerned about, and can only be said to have temporarily eased tensions.
The unusual activity in the Wujiaochang Pizza Index on Saturday and Sunday sparked market speculation, contributing to the surge in gold prices on Friday.
In addition, during this week's window of major US economic data, non-farm payrolls and CPI will be released one after another. However, due to the previous weak employment data, Challenger and job openings data all indicate a weak labor market. At the same time, the University of Michigan's inflation expectations survey shows that the inflation expectation result is 3.5%, which is also lower than the market expectation.
As a result, the market began betting that non-farm payrolls and CPI would show signs of controlled inflation and a weak labor market, which was also an important reason for the surge in the US equity market and the rise in gold prices.
(Trend chart of University of Michigan Consumer Confidence Index and Inflation Expectations Survey)
The delayed non-farm payroll report on Wednesday and the consumer inflation data on Friday will directly anchor market pricing in the Fed's rate cut path, thereby dominating the flow of funds into the dollar index and the price movement of spot gold.
Trading environment tightens, net long positions in precious metals contract sharply across the board.
The accelerated deleveraging process in managed funds accounts has led to a significant reduction in net long positions in precious metals, further weakening the financial support for gold and potentially limiting its upward movement. A period of consolidation is needed, awaiting news and data to revitalize the market.
Affected by multiple factors such as rising market volatility, increased exchange margin requirements, and tighter risk value constraints, managed funds accounts had already begun selling on rallies in the previous weeks, and are now further accelerating the pace of deleveraging in order to cope with the complex trading environment.
Looking at the specific positions, long positions in precious metals have all contracted significantly: net long positions in gold have decreased by 22% to 92,072 contracts, the lowest level since October; net long positions in silver have plummeted by 38% to 4,491 contracts, a 23-month low; and platinum positions have decreased by 42% to only 1,083 contracts, with the position status now close to neutral.
The sharp contraction in liquidity has made it difficult for gold bulls to form an effective upward momentum, which is the core reason for the current weakness in gold prices.
(COT Gold Managed Funds Account Position Trend Chart: Net long positions suffered severe losses after the plunge on February 2nd)
Gold is supported by two fundamental factors: central bank gold purchases and expectations of interest rate cuts.
Gold's ability to hold above the $5,000 mark is primarily due to the combined support of the rigid demand from central bank gold purchases and the expectation of a Federal Reserve interest rate cut.
On the one hand, the People's Bank of China's continued gold purchases have become an important support for gold demand. Data released by the central bank shows that it has achieved the fifteenth consecutive month of gold purchases in January. Against the backdrop of fiscal pressure on major economies, the allocation value of gold has become prominent, and the allocation demand remains rigid.
The central bank's gold holdings increased by 40,000 troy ounces that month, reaching a total of 74.19 million troy ounces. Foreign exchange reserves also climbed to US$369.58 billion. The central bank's continued efforts have provided a solid bottom support for gold prices.
On the other hand, rising expectations of a Federal Reserve rate cut, coupled with a weakening dollar, have provided a temporary boost to gold, a non-interest-bearing asset.
Pricing data from the CME FedWatch Tool shows that trading expectations for at least multiple rate cuts by the Federal Reserve in 2026 have further intensified. Meanwhile, last week's U.S. economic data revealed signs of a weakening labor market, which not only confirmed the rationale for further easing of monetary policy by the Fed but also further strengthened market bets on rate cuts.
Meanwhile, statements from senior U.S. officials regarding the nominee for Federal Reserve chairman have exacerbated market concerns about the Fed's policy independence. Coupled with the structural trend of global de-dollarization, this has pushed the dollar index down for two consecutive trading days, moving away from the two-week high reached last Thursday, further amplifying the price support for gold.
Summary and Technical Analysis:
Overall, spot gold is currently in a state of mutual support and resistance from fundamentals. The deleveraging of funds has led to a contraction in positions, further amplifying the balance between bulls and bears. In the short term, gold prices are likely to continue to consolidate around the $5,000 mark.
As for the subsequent trend, the direction of gold's breakout will be determined by two key factors: first, the performance of core economic data such as US non-farm payrolls and inflation, which will directly affect the market pricing of the Fed's interest rate cut path, and thus dominate the trend of the dollar and gold.
Secondly, regarding changes in the funding situation, attention should be paid to whether the deleveraging process of the managed funds account has slowed down, as well as the marginal trends in market risk appetite.
Only when the balance of power between buyers and sellers shifts significantly can gold break out of its current sideways trading pattern and achieve a directional breakout.
From a technical perspective, spot gold rebounded to the 0.618 level before its upward momentum slowed. The resistance level is at 5125, which is also the psychological level of 5000 points and the upper rail of the upward channel.
Support levels are at 4940 and below that, around 4860, which corresponds to the blue ascending channel line.
(Spot gold daily chart, source: FX678)
At 20:35 Beijing time, spot gold was trading at $5015.11 per ounce.
- Risk Warning and Disclaimer
- The market involves risk, and trading may not be suitable for all investors. This article is for reference only and does not constitute personal investment advice, nor does it take into account certain users’ specific investment objectives, financial situation, or other needs. Any investment decisions made based on this information are at your own risk.