Could the "golden" opportunity of 2026 lie in US Treasury bonds?
2026-02-09 21:06:33
On Monday (February 9), the US Treasury market saw a moderate consolidation, with the benchmark 10-year Treasury yield rising slightly to around 4.229%. Looking back at last week and the beginning of this week, the market exhibited typical characteristics of "low volatility amid high volatility." Although there were some fluctuations during the day, the 10-year yield has been largely confined to a narrow range of 4.21% to 4.29% since the beginning of February. Behind this calm is the market's deep anticipation of the upcoming release of delayed key economic data and the future policy path of the Federal Reserve (Fed).
Of particular note is the "bearish steepening" of the yield curve—long-term yields (such as the 30-year yield) have remained relatively firm, while short-term yields (such as the 2-year yield) have fluctuated significantly due to repeated speculation on interest rate cuts, with the spread between 10-year and 2-year Treasury yields hovering around 72 basis points. This pattern suggests that market concerns about long-term inflation and the fiscal outlook are temporarily suppressing expectations of a possible shift towards looser short-term monetary policy.
Current market sentiment is mainly driven by several competing forces, making it difficult to determine the direction of the market.
First, signs of a cooling labor market provided key support for the bond market. Recent media reports indicated that the US job market is experiencing a kind of "deep freeze," with multiple factors contributing to a slowdown in job creation. Previously released January employment data (delayed for various reasons) was significantly weaker than expected, briefly pushing the 10-year yield down rapidly to around 4.21%. This reinforced market expectations of weakening economic growth momentum and left room for speculation about possible future Fed rate cuts. However, the market reaction was swift and short-lived, with yields quickly rebounding from their lows, indicating that the mainstream narrative of a "soft landing" and "sticky inflation" has not been easily shaken.
Secondly, the Federal Reserve's policy outlook is fraught with uncertainty. While the market widely expects the Fed to enter a period of observation after three consecutive rate cuts, potential changes in leadership introduce new variables. The market interprets the candidate for the previous chairman as potentially hawkish, which has exacerbated concerns about the extent of long-term monetary policy tightening and has become a significant factor driving up long-term yields and contributing to a bearish steepening of the yield curve.
Third, fiscal and technical factors continue to exert pressure. The U.S. government's massive net borrowing program this quarter means that the supply of Treasury bonds will remain high. Meanwhile, the Federal Reserve's repurchase operations on its balance sheet are relatively limited, weakening its ability to regulate the market. These factors combined create substantial supply pressure on long-term bonds, limiting the downside potential for yields.
Finally, external events and market sentiment cannot be ignored. Globally, political uncertainty in the UK triggered volatility in the pound and UK government bonds, while the strong performance of the Japanese stock market after political events reflected regional divergences in risk appetite. While these events do not directly dominate the trend of US Treasury bonds, they indirectly affect the pricing of dollar assets by influencing global capital flows and risk sentiment. Of particular note is the recent increase in rhetoric regarding tariffs; such policy uncertainty can trigger risk aversion in the market and may add uncertainty to the future inflation path by affecting import prices and growth expectations.
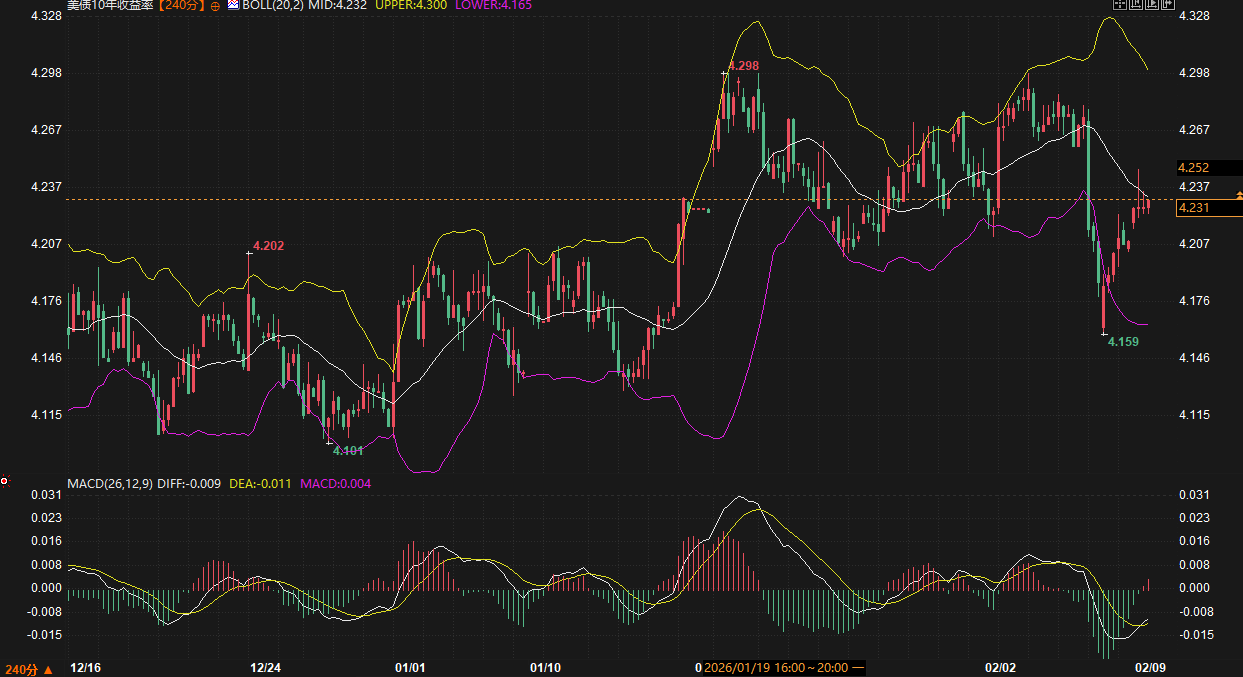
From a purely technical analysis perspective, the current 10-year US Treasury yield is at a critical equilibrium point. According to the 240-minute chart data as of the morning session on February 9th, the 10-year yield is temporarily at 4.229%, a slight increase during the day. The chart shows that the price is fluctuating around the middle Bollinger Band (parameter 20,2) at around 4.232%. Currently, the upper Bollinger Band is at 4.300%, and the lower band is at 4.165%, with the channel showing a narrowing trend, which usually indicates a contraction in volatility and an upcoming directional choice.
The MACD momentum indicator (parameters 26,12,9) shows a DIF value of -0.009 and a DEA value of -0.011, with the histogram slightly turning red but close to the zero axis. This also indicates that the market's bullish and bearish forces are temporarily at a delicate balance, lacking strong unilateral momentum. In terms of trading volume, the main contract remained above average during the morning session, showing the high level of attention and divergence among market participants at this crucial juncture.
In summary, the key support and resistance levels are now clear. For the yield on 10-year US Treasury futures (contract code: TYH26), the primary resistance level is concentrated between 4.285% and 4.300%. This area not only represents the upper edge of the recent trading range but also approaches the upper Bollinger Band and encompasses the high reached in early February. If new negative fundamental factors emerge (such as stronger-than-expected inflation data) and push the yield to break through this area, it could open the door to testing the 4.35%-4.40% range.
The key support zone below is located at 4.165%-4.210%. The lower edge of this zone is formed by the lower Bollinger Band and the low of February 5th, while the upper edge is the starting point of recent rebounds that have been tested multiple times. Any weak economic data or a sudden surge in risk aversion could prompt yields to fall back to this zone to seek support. A strong break below this zone could trigger a larger decline, targeting the psychological level of 4.10%.
During trading, close attention should be paid to how the price tests the aforementioned boundaries, and the accompanying trading volume upon breakout. Furthermore, the interconnected changes in yields across different maturities, particularly whether the 2-year/10-year yield spread continues to widen (bearish steepening), will directly verify changes in market expectations of "reflation" or "recession."
Looking ahead to the next week and several weeks, the "quiet" state of the US Treasury market is unlikely to last. A series of key data releases, including non-farm payrolls, the Consumer Price Index (CPI), and retail sales, will be released in quick succession. These data will directly test the validity of the two core narratives of "inflation stickiness" and "economic resilience." The market is highly likely to experience significant two-way volatility after these data releases.
A prominent macro strategist recently suggested that US Treasury bonds may present the next significant potential trading opportunity. Their analysis, based on observations of commodity cycles and financial market volatility, argues that if deflationary forces regain dominance amid slowing economic growth, the volatility of the bond market, which has experienced prolonged turmoil, could fundamentally shift. This view implies that at current yield levels, the long-term risk-reward ratio of the bond market is undergoing a positive change.
Regardless of the market's direction, the US Treasury market in 2026 is unlikely to repeat the one-sided trend seen in the stock market in 2025. It is more likely to present a complex picture of "high-yield coupons as a floor, coupled with opportunities for periodic capital gains." For investors, the historically high yield range of 4.20%-4.30% offers both substantial holding returns and suggests an increasing possibility of data-driven or policy-triggered market fluctuations. Until the direction becomes clear, maintaining vigilance and flexibility may be the best strategy for navigating this volatile market.
Of particular note is the "bearish steepening" of the yield curve—long-term yields (such as the 30-year yield) have remained relatively firm, while short-term yields (such as the 2-year yield) have fluctuated significantly due to repeated speculation on interest rate cuts, with the spread between 10-year and 2-year Treasury yields hovering around 72 basis points. This pattern suggests that market concerns about long-term inflation and the fiscal outlook are temporarily suppressing expectations of a possible shift towards looser short-term monetary policy.
Fundamentals: A mix of bullish and bearish factors, with the inflation narrative remaining central.
Current market sentiment is mainly driven by several competing forces, making it difficult to determine the direction of the market.
First, signs of a cooling labor market provided key support for the bond market. Recent media reports indicated that the US job market is experiencing a kind of "deep freeze," with multiple factors contributing to a slowdown in job creation. Previously released January employment data (delayed for various reasons) was significantly weaker than expected, briefly pushing the 10-year yield down rapidly to around 4.21%. This reinforced market expectations of weakening economic growth momentum and left room for speculation about possible future Fed rate cuts. However, the market reaction was swift and short-lived, with yields quickly rebounding from their lows, indicating that the mainstream narrative of a "soft landing" and "sticky inflation" has not been easily shaken.
Secondly, the Federal Reserve's policy outlook is fraught with uncertainty. While the market widely expects the Fed to enter a period of observation after three consecutive rate cuts, potential changes in leadership introduce new variables. The market interprets the candidate for the previous chairman as potentially hawkish, which has exacerbated concerns about the extent of long-term monetary policy tightening and has become a significant factor driving up long-term yields and contributing to a bearish steepening of the yield curve.
Third, fiscal and technical factors continue to exert pressure. The U.S. government's massive net borrowing program this quarter means that the supply of Treasury bonds will remain high. Meanwhile, the Federal Reserve's repurchase operations on its balance sheet are relatively limited, weakening its ability to regulate the market. These factors combined create substantial supply pressure on long-term bonds, limiting the downside potential for yields.
Finally, external events and market sentiment cannot be ignored. Globally, political uncertainty in the UK triggered volatility in the pound and UK government bonds, while the strong performance of the Japanese stock market after political events reflected regional divergences in risk appetite. While these events do not directly dominate the trend of US Treasury bonds, they indirectly affect the pricing of dollar assets by influencing global capital flows and risk sentiment. Of particular note is the recent increase in rhetoric regarding tariffs; such policy uncertainty can trigger risk aversion in the market and may add uncertainty to the future inflation path by affecting import prices and growth expectations.
Technical Analysis: The market is stuck in a key range, awaiting a directional breakout.
From a purely technical analysis perspective, the current 10-year US Treasury yield is at a critical equilibrium point. According to the 240-minute chart data as of the morning session on February 9th, the 10-year yield is temporarily at 4.229%, a slight increase during the day. The chart shows that the price is fluctuating around the middle Bollinger Band (parameter 20,2) at around 4.232%. Currently, the upper Bollinger Band is at 4.300%, and the lower band is at 4.165%, with the channel showing a narrowing trend, which usually indicates a contraction in volatility and an upcoming directional choice.
The MACD momentum indicator (parameters 26,12,9) shows a DIF value of -0.009 and a DEA value of -0.011, with the histogram slightly turning red but close to the zero axis. This also indicates that the market's bullish and bearish forces are temporarily at a delicate balance, lacking strong unilateral momentum. In terms of trading volume, the main contract remained above average during the morning session, showing the high level of attention and divergence among market participants at this crucial juncture.
In summary, the key support and resistance levels are now clear. For the yield on 10-year US Treasury futures (contract code: TYH26), the primary resistance level is concentrated between 4.285% and 4.300%. This area not only represents the upper edge of the recent trading range but also approaches the upper Bollinger Band and encompasses the high reached in early February. If new negative fundamental factors emerge (such as stronger-than-expected inflation data) and push the yield to break through this area, it could open the door to testing the 4.35%-4.40% range.
The key support zone below is located at 4.165%-4.210%. The lower edge of this zone is formed by the lower Bollinger Band and the low of February 5th, while the upper edge is the starting point of recent rebounds that have been tested multiple times. Any weak economic data or a sudden surge in risk aversion could prompt yields to fall back to this zone to seek support. A strong break below this zone could trigger a larger decline, targeting the psychological level of 4.10%.
During trading, close attention should be paid to how the price tests the aforementioned boundaries, and the accompanying trading volume upon breakout. Furthermore, the interconnected changes in yields across different maturities, particularly whether the 2-year/10-year yield spread continues to widen (bearish steepening), will directly verify changes in market expectations of "reflation" or "recession."
Market Outlook: The calm before volatility returns may conceal significant opportunities.
Looking ahead to the next week and several weeks, the "quiet" state of the US Treasury market is unlikely to last. A series of key data releases, including non-farm payrolls, the Consumer Price Index (CPI), and retail sales, will be released in quick succession. These data will directly test the validity of the two core narratives of "inflation stickiness" and "economic resilience." The market is highly likely to experience significant two-way volatility after these data releases.
A prominent macro strategist recently suggested that US Treasury bonds may present the next significant potential trading opportunity. Their analysis, based on observations of commodity cycles and financial market volatility, argues that if deflationary forces regain dominance amid slowing economic growth, the volatility of the bond market, which has experienced prolonged turmoil, could fundamentally shift. This view implies that at current yield levels, the long-term risk-reward ratio of the bond market is undergoing a positive change.
Regardless of the market's direction, the US Treasury market in 2026 is unlikely to repeat the one-sided trend seen in the stock market in 2025. It is more likely to present a complex picture of "high-yield coupons as a floor, coupled with opportunities for periodic capital gains." For investors, the historically high yield range of 4.20%-4.30% offers both substantial holding returns and suggests an increasing possibility of data-driven or policy-triggered market fluctuations. Until the direction becomes clear, maintaining vigilance and flexibility may be the best strategy for navigating this volatile market.
- Risk Warning and Disclaimer
- The market involves risk, and trading may not be suitable for all investors. This article is for reference only and does not constitute personal investment advice, nor does it take into account certain users’ specific investment objectives, financial situation, or other needs. Any investment decisions made based on this information are at your own risk.