Is the US Treasury yield and dollar poised for a major move? Watch these two lines to see whether they rise or fall after the quiet period!
2026-02-10 21:00:11
On Tuesday (February 10), global financial markets entered a typical wait-and-see mode ahead of key economic data releases. The US dollar index remained range-bound around 96.90, rising slightly by 0.02% on the day, attempting to find a new equilibrium point after Monday's pullback. Correspondingly, the 10-year US Treasury yield continued its downward trend, falling 0.62% to 4.175% on the day, with the bond market exhibiting a mild "bull market flattening" trend. Trading is currently relatively thin, with participants holding their breath awaiting the US employment report and Consumer Price Index (CPI) data later this week for clearer clues about the future path of interest rates. During this data vacuum, the short-term technical levels of the US dollar and the fluctuations in US Treasury yields together paint a cautious yet tense picture of the market.

The core fundamental factors currently influencing the market are characterized by a multi-dimensional interplay, mainly revolving around central bank officials' remarks, economic data expectations, and the correlation with overseas markets.
First, policymakers' assessments of the impact of exchange rates have provided a buffer for the dollar's trajectory. A Federal Reserve governor recently stated publicly that a "very significant movement" in the dollar would be necessary to have a primary impact on domestic consumer inflation. This statement was interpreted by the market as indicating that current dollar volatility has not yet reached a threshold sufficient to alter the Fed's monetary policy considerations, thus mitigating some of the market's excessive concerns that a dollar depreciation might force the Fed to change course. At the same time, former President Trump's comments on economic growth potential, as well as his inclinations regarding Fed personnel appointments, have added a layer of long-term policy uncertainty to the market.
Secondly, while economic data shows resilience, underlying concerns remain. Although the U.S. small business confidence index unexpectedly declined slightly in January, indicating increased uncertainty among business owners awaiting stronger signs of economic recovery, the index remains above its long-term average. More importantly, upcoming retail sales data is expected to confirm a robust 2025 holiday shopping season, supporting the view that the U.S. economy's endogenous momentum continues. Furthermore, a New York Fed survey showed that long-term consumer inflation expectations remain stable, a positive sign for the Federal Reserve, which seeks to anchor inflation expectations.
Finally, the dynamics of overseas markets had a significant spillover effect. The strong rebound in Japanese government bonds was a major external driver of the overnight strength in US Treasuries. As the Japanese government explicitly ruled out the possibility of issuing new bonds to fund food tax cuts, concerns about a surge in Japanese government bond supply were significantly alleviated, pushing the 10-year Japanese bond yield down significantly in a single day. This trend, through the linkage mechanism of global bond markets, provided direct buying support for US Treasuries. Statements from European Central Bank officials regarding tolerating short-term inflation below target suggested that the policy divergence narrative among major central banks might continue, indirectly supporting the relative interest rate advantage of the US dollar.
From a technical analysis perspective, both the US dollar and US Treasury bonds are near key short-term levels, and their directional direction depends on fundamental catalysts.
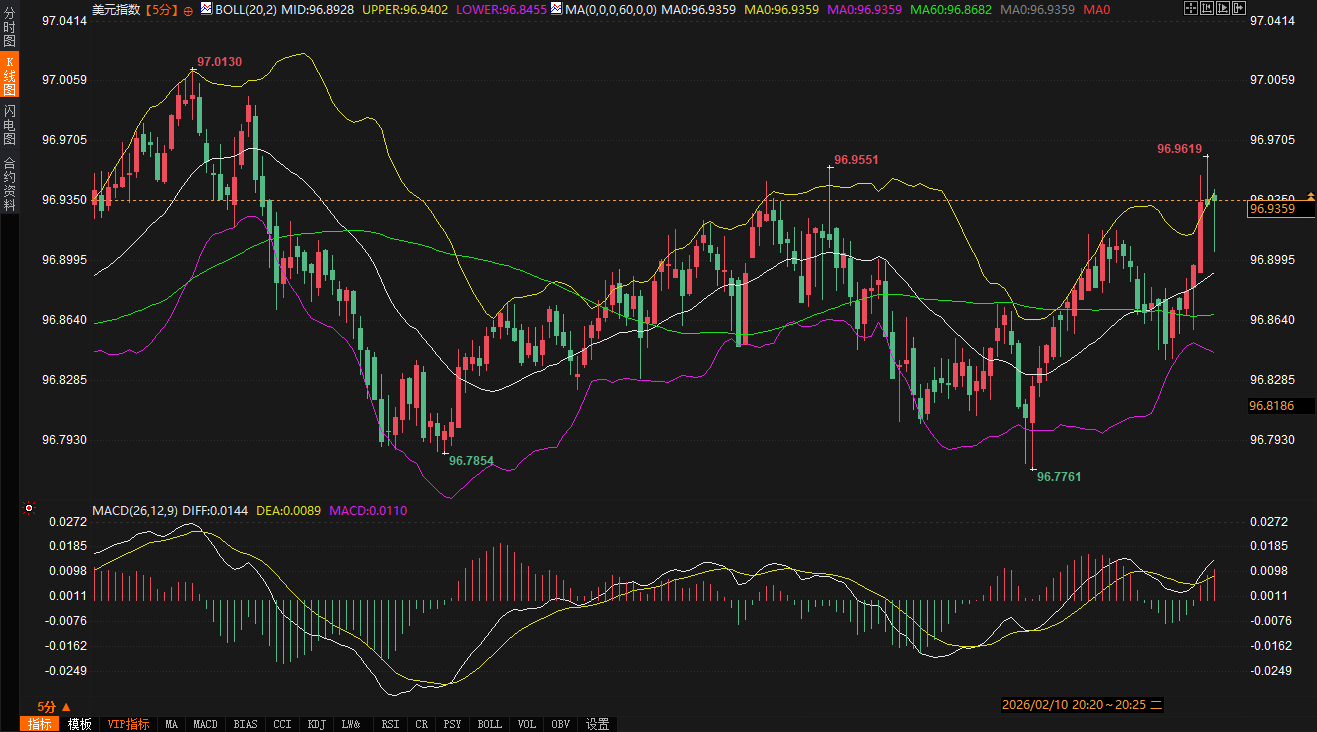
Regarding the US Dollar Index, referring to the DXY main contract, its 240-minute chart shows the price hovering closely around the Bollinger Band middle line (96.8826), with the upper and lower bands (96.9143 - 96.8506) narrowing abnormally, indicating that volatility compression is about to end. In the MACD indicator, the DIFF line is slightly lower than the DEA line, but both are close to the zero axis, indicating weak short-term momentum and the market is in a critical state of equilibrium between bulls and bears. Key support and resistance zones can be defined as follows: the first support is at 96.85 (lower Bollinger Band and recent consolidation low area); a break below this level could open up space for a correction towards 96.70. The first resistance is in the 96.91-96.95 area (upper Bollinger Band and near Monday's high); a valid break above this level would confirm the end of the short-term pullback and could potentially test the 97.10 level. During the trading session, close attention should be paid to the price's testing of the Bollinger Band edges and whether the MACD can form a golden cross near the zero axis, as this would be a signal of short-term momentum shift.
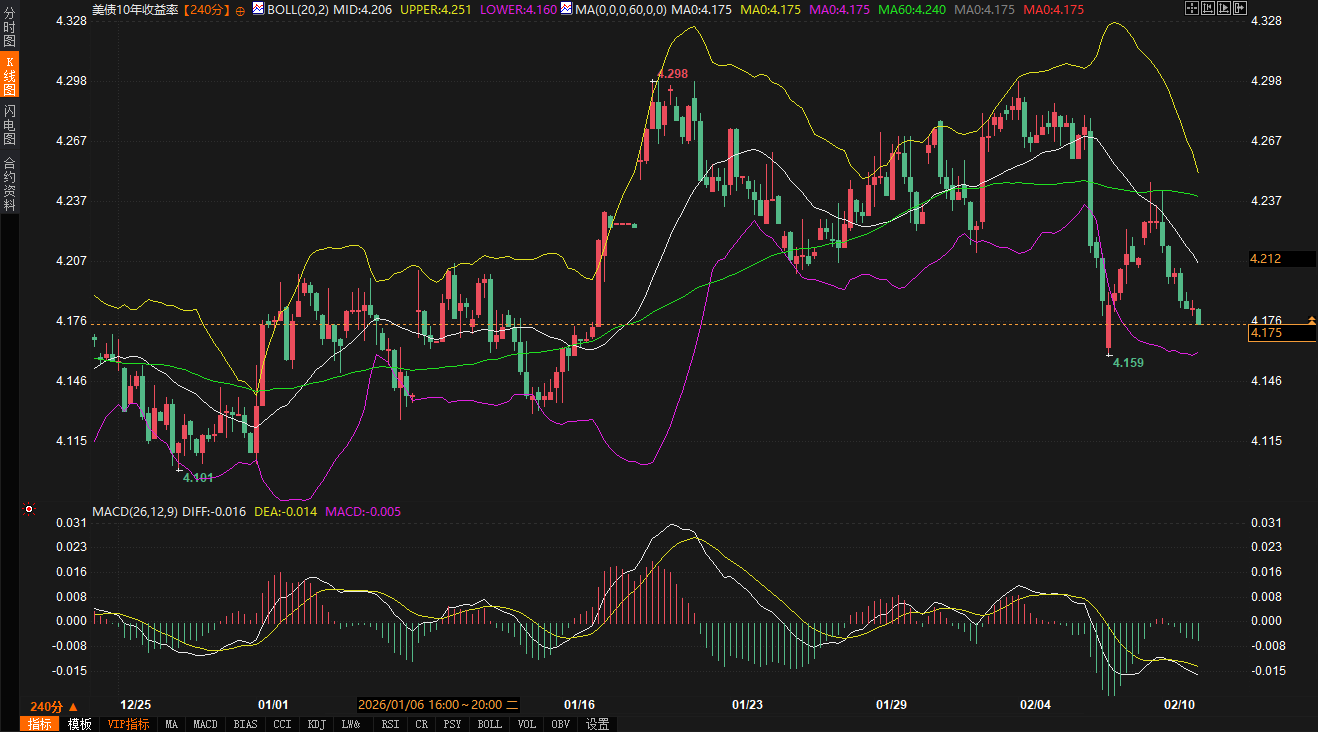
Regarding the 10-year US Treasury yield, its 240-minute chart shows that the price has fallen back below the Bollinger Band middle line (4.206%) and is testing the lower line (4.160%) support. The MACD indicator continued its downward trend after a death cross below the zero line, with the negative momentum bars slightly expanding, suggesting that short-term adjustment pressure has not yet been fully released. The current core trading range is between 4.16% (lower Bollinger Band and recent technical support) and 4.206% (middle Bollinger Band, also a psychological level). If it breaks below the 4.16% support, the yield may further decline to the 4.13%-4.14% area; conversely, if it recovers and holds above 4.206%, the short-term adjustment may be over, and it is expected to move back towards the upper line (4.251%). During the trading session, it is crucial to observe the yield's reaction around 4.16% and its divergence or synchronization with the US dollar index. It is particularly important to note that the trading range of US Treasury futures (112-05 to 112-10.5) has been broken, and attention should be paid to whether a new consolidation platform will form.
Looking ahead to the next 48 to 72 hours, the market will gradually transition from a "wait-and-see" mode to a "data-driven" mode. Before the release of core economic data, the US dollar and US Treasury bonds are expected to maintain a range-bound trading pattern, but volatility may gradually increase as the data release date approaches.
The US dollar index will be subject to a two-way pull. On one hand, the stability of the Japanese government bond market and the dovish stance of the European Central Bank may limit the downside potential of the dollar, and even provide mild support. On the other hand, market doubts about the Federal Reserve's policy path are unlikely to dissipate until confirmed by data, which will suppress the dollar's upward momentum. Therefore, the dollar is more likely to consolidate within a wide range of 96.70 to 97.10 until data provides a clear direction. Any re-emergence of news regarding "tariff rhetoric" could quickly ignite risk aversion, pushing the dollar higher as a safe-haven asset.
The short-term negative correlation between the 10-year US Treasury yield and the US dollar may be more pronounced during data lulls. A stronger dollar due to safe-haven demand or interest rate advantages could put pressure on US Treasury prices, pushing up yields. However, market concerns about potentially weaker-than-expected economic data, along with spillover support from the strength of global bond markets (especially Japanese bonds), will provide significant support for yields. Yields are expected to find direction within the 4.13% to 4.25% range. The Japanese market being closed for a holiday on Thursday may reduce a significant source of external volatility, allowing the US Treasury market to focus more on domestic factors.
In summary, the market is currently in the calm before the storm. Trader position adjustments, pre-data release expectation management, and sporadic information from overseas markets will be the main factors dominating the market in the next two to three trading days. Investors should remain vigilant, focusing on whether the US dollar index breaks through key technical levels and whether US Treasury yields can hold their support levels. These will be leading indicators for judging the market's medium-term direction after the data release. Before the data becomes clear, restraint and patience are the best strategies for dealing with the current market situation.
Fundamental Focus: Policy Rhetoric, Economic Resilience, and Data Outlook
The core fundamental factors currently influencing the market are characterized by a multi-dimensional interplay, mainly revolving around central bank officials' remarks, economic data expectations, and the correlation with overseas markets.
First, policymakers' assessments of the impact of exchange rates have provided a buffer for the dollar's trajectory. A Federal Reserve governor recently stated publicly that a "very significant movement" in the dollar would be necessary to have a primary impact on domestic consumer inflation. This statement was interpreted by the market as indicating that current dollar volatility has not yet reached a threshold sufficient to alter the Fed's monetary policy considerations, thus mitigating some of the market's excessive concerns that a dollar depreciation might force the Fed to change course. At the same time, former President Trump's comments on economic growth potential, as well as his inclinations regarding Fed personnel appointments, have added a layer of long-term policy uncertainty to the market.
Secondly, while economic data shows resilience, underlying concerns remain. Although the U.S. small business confidence index unexpectedly declined slightly in January, indicating increased uncertainty among business owners awaiting stronger signs of economic recovery, the index remains above its long-term average. More importantly, upcoming retail sales data is expected to confirm a robust 2025 holiday shopping season, supporting the view that the U.S. economy's endogenous momentum continues. Furthermore, a New York Fed survey showed that long-term consumer inflation expectations remain stable, a positive sign for the Federal Reserve, which seeks to anchor inflation expectations.
Finally, the dynamics of overseas markets had a significant spillover effect. The strong rebound in Japanese government bonds was a major external driver of the overnight strength in US Treasuries. As the Japanese government explicitly ruled out the possibility of issuing new bonds to fund food tax cuts, concerns about a surge in Japanese government bond supply were significantly alleviated, pushing the 10-year Japanese bond yield down significantly in a single day. This trend, through the linkage mechanism of global bond markets, provided direct buying support for US Treasuries. Statements from European Central Bank officials regarding tolerating short-term inflation below target suggested that the policy divergence narrative among major central banks might continue, indirectly supporting the relative interest rate advantage of the US dollar.
Technical Analysis: Key Ranges and Intraday Observation Points
From a technical analysis perspective, both the US dollar and US Treasury bonds are near key short-term levels, and their directional direction depends on fundamental catalysts.
Regarding the US Dollar Index, referring to the DXY main contract, its 240-minute chart shows the price hovering closely around the Bollinger Band middle line (96.8826), with the upper and lower bands (96.9143 - 96.8506) narrowing abnormally, indicating that volatility compression is about to end. In the MACD indicator, the DIFF line is slightly lower than the DEA line, but both are close to the zero axis, indicating weak short-term momentum and the market is in a critical state of equilibrium between bulls and bears. Key support and resistance zones can be defined as follows: the first support is at 96.85 (lower Bollinger Band and recent consolidation low area); a break below this level could open up space for a correction towards 96.70. The first resistance is in the 96.91-96.95 area (upper Bollinger Band and near Monday's high); a valid break above this level would confirm the end of the short-term pullback and could potentially test the 97.10 level. During the trading session, close attention should be paid to the price's testing of the Bollinger Band edges and whether the MACD can form a golden cross near the zero axis, as this would be a signal of short-term momentum shift.
Regarding the 10-year US Treasury yield, its 240-minute chart shows that the price has fallen back below the Bollinger Band middle line (4.206%) and is testing the lower line (4.160%) support. The MACD indicator continued its downward trend after a death cross below the zero line, with the negative momentum bars slightly expanding, suggesting that short-term adjustment pressure has not yet been fully released. The current core trading range is between 4.16% (lower Bollinger Band and recent technical support) and 4.206% (middle Bollinger Band, also a psychological level). If it breaks below the 4.16% support, the yield may further decline to the 4.13%-4.14% area; conversely, if it recovers and holds above 4.206%, the short-term adjustment may be over, and it is expected to move back towards the upper line (4.251%). During the trading session, it is crucial to observe the yield's reaction around 4.16% and its divergence or synchronization with the US dollar index. It is particularly important to note that the trading range of US Treasury futures (112-05 to 112-10.5) has been broken, and attention should be paid to whether a new consolidation platform will form.
Outlook for the next 2-3 days: Narrow range trading before data release.
Looking ahead to the next 48 to 72 hours, the market will gradually transition from a "wait-and-see" mode to a "data-driven" mode. Before the release of core economic data, the US dollar and US Treasury bonds are expected to maintain a range-bound trading pattern, but volatility may gradually increase as the data release date approaches.
The US dollar index will be subject to a two-way pull. On one hand, the stability of the Japanese government bond market and the dovish stance of the European Central Bank may limit the downside potential of the dollar, and even provide mild support. On the other hand, market doubts about the Federal Reserve's policy path are unlikely to dissipate until confirmed by data, which will suppress the dollar's upward momentum. Therefore, the dollar is more likely to consolidate within a wide range of 96.70 to 97.10 until data provides a clear direction. Any re-emergence of news regarding "tariff rhetoric" could quickly ignite risk aversion, pushing the dollar higher as a safe-haven asset.
The short-term negative correlation between the 10-year US Treasury yield and the US dollar may be more pronounced during data lulls. A stronger dollar due to safe-haven demand or interest rate advantages could put pressure on US Treasury prices, pushing up yields. However, market concerns about potentially weaker-than-expected economic data, along with spillover support from the strength of global bond markets (especially Japanese bonds), will provide significant support for yields. Yields are expected to find direction within the 4.13% to 4.25% range. The Japanese market being closed for a holiday on Thursday may reduce a significant source of external volatility, allowing the US Treasury market to focus more on domestic factors.
In summary, the market is currently in the calm before the storm. Trader position adjustments, pre-data release expectation management, and sporadic information from overseas markets will be the main factors dominating the market in the next two to three trading days. Investors should remain vigilant, focusing on whether the US dollar index breaks through key technical levels and whether US Treasury yields can hold their support levels. These will be leading indicators for judging the market's medium-term direction after the data release. Before the data becomes clear, restraint and patience are the best strategies for dealing with the current market situation.
- Risk Warning and Disclaimer
- The market involves risk, and trading may not be suitable for all investors. This article is for reference only and does not constitute personal investment advice, nor does it take into account certain users’ specific investment objectives, financial situation, or other needs. Any investment decisions made based on this information are at your own risk.