US Treasury yields have been stuck at 4.16% for three days, and the dollar is also falling. What is the market waiting for?
2026-02-12 20:53:11
On Thursday (February 12), the US Treasury market continued its modest recovery in a quiet trading environment. The yield curve steepened slightly during the Asian session, then flattened during the European session, with the 10-year Treasury yield last quoted at 4.164%, a slight recovery from this week's low of 4.124%. Meanwhile, the US dollar index hovered around 96.84, having experienced a second round of pressure after rising and then falling back the previous week. From a cross-market perspective, the yield on ultra-long-term Japanese government bonds fell sharply to its lowest level since January 13, accelerating the flattening of the yield curve, a marginal change worth noting in the global fixed-income market.
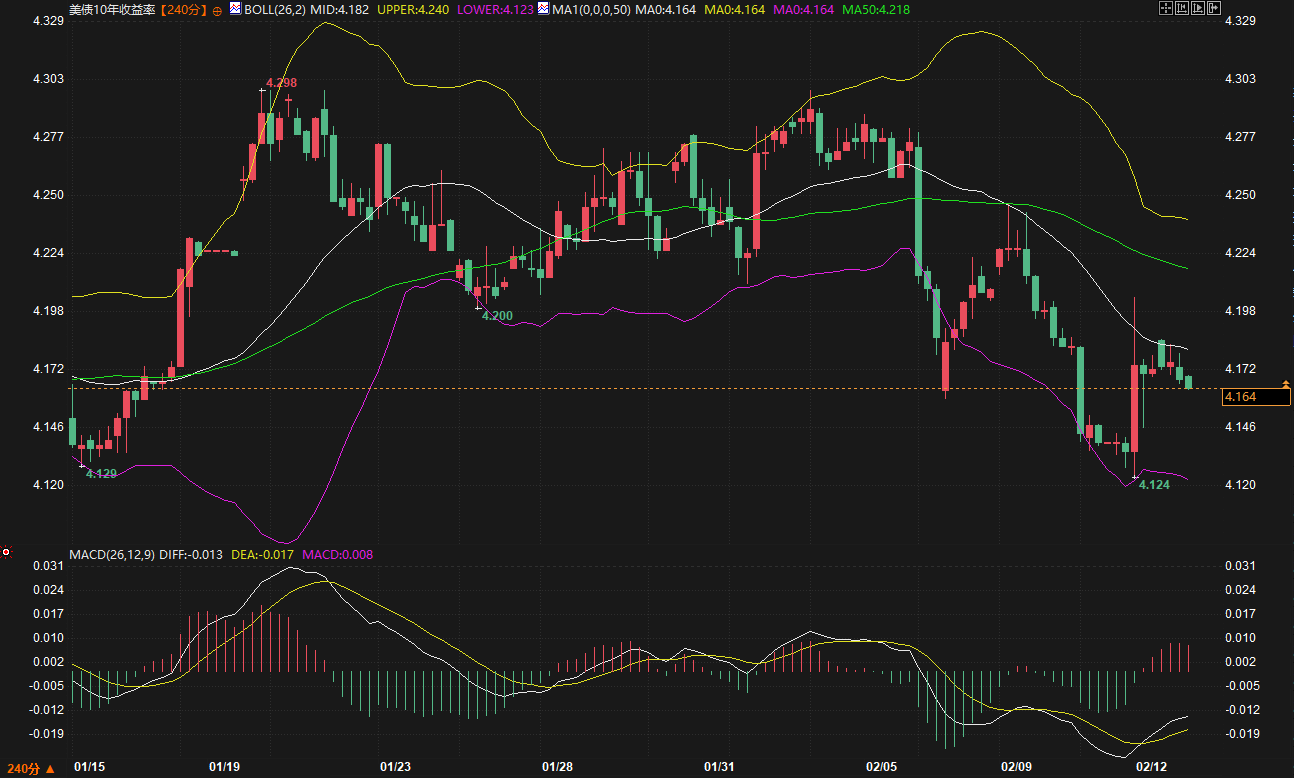
Observing the 240-minute candlestick chart, the 10-year US Treasury yield, after reaching a high of 4.298% on January 20, has exhibited a "double top – pullback – low-level consolidation" pattern. After dipping to 4.124% on February 10, it rebounded slightly, and the current price is at 4.164%, highly converging with short-term and medium-term moving averages. This technical characteristic typically indicates that short-term market costs are converging, and the bullish and bearish forces are temporarily in a weak equilibrium.
The Bollinger Bands indicator shows the upper band at 4.240%, the lower band at 4.123%, and the middle band at 4.182%. The current yield is below the middle band, indicating that the short-term bearish trend has not yet reversed. It's worth noting that the Bollinger Bands have been narrowing since early February, and volatility has clearly contracted from previous highs, suggesting the market is awaiting a new catalyst to break the current consolidation. The MACD histogram has turned positive, and the DIFF and DEA lines are converging in the negative range, showing initial signs of bullish divergence, reflecting weakening bearish momentum. However, a clear golden cross signal has not yet formed, indicating that bulls still lack the willingness to actively push higher.
In terms of resistance structure, 4.218% is the location of the 50-day moving average (MA50), which, together with the previous small consolidation area of 4.220%-4.240%, forms the first resistance zone. If this area is broken, the double-top neckline near 4.280% will become a more crucial resistance test level. On the support side, 4.124% is the low point of this round of pullback, coinciding with the lower Bollinger Band at 4.123%, forming a support zone. The effectiveness of this area's defense will directly determine whether the yield will begin a new round of downward movement.
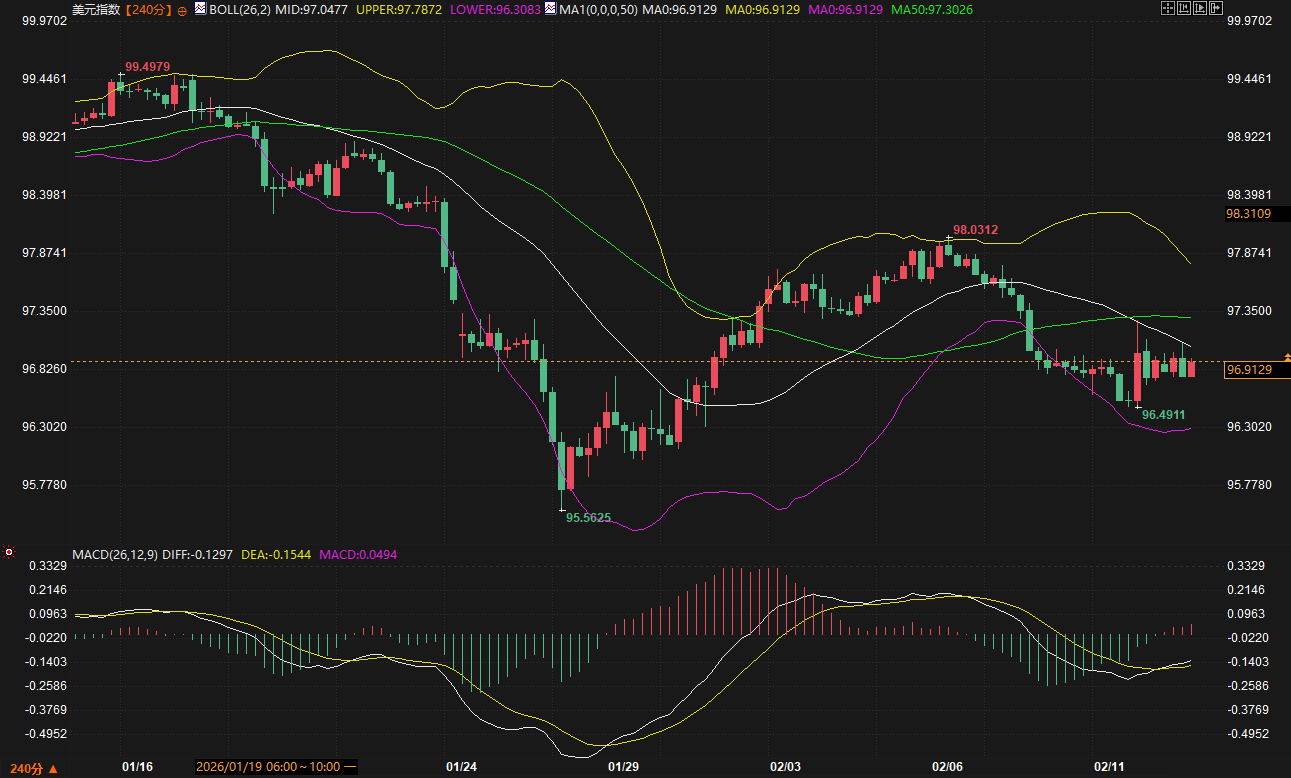
The 240-minute chart of the US dollar index shows that after hitting a low of 95.5625 on January 27th, the market rebounded to around 98.03, but then fell back to around 96.90 in early February, exhibiting a pattern of "decreasing rebound height and continued downward pressure." The current price of 96.9129 coincides perfectly with the short-term moving averages, but is significantly lower than the 50-day moving average (MA50) at 97.3026, indicating that the bearish trend has not fundamentally reversed.
The Bollinger Bands indicator also shows a narrowing channel with prices below the middle band, and volatility has clearly declined from its highs in late January. Notably, the US Dollar Index MACD has formed a golden cross in negative territory, with the DIFF line above the DEA line, contrasting somewhat with the bullish divergence signal on the US Treasury yield MACD. This technical divergence reflects that while the pricing logic of US dollar assets already incorporates some expectations of easing in the exchange rate, the bond market is still awaiting clearer policy signals for confirmation.
From a correlation perspective, the simultaneous decline in the US dollar index and US Treasury yields from mid to late January indicates that the dollar failed to effectively fulfill its safe-haven function during periods of heightened risk aversion. Conversely, since February, the dollar index has struggled to rebound, while US Treasury yields have remained low, exhibiting a low-level resonance between the two. A well-known institution believes that market expectations for a shift in Federal Reserve monetary policy are being repriced, a macroeconomic logic that is putting downward pressure on the dollar and limiting the upside potential of US Treasury yields.
The Japanese government bond market saw significant structural changes this week. While short-term yields weakened, with the 10-year yield rising to 2.235% at Tuesday's close, the 30-year yield fell sharply by 8 basis points to 3.42%, a new low since January 13. This flattening yield curve, characterized by stable short-term and declining long-term yields, was directly triggered by the Prime Minister's policy statement that the tax cut commitment would not rely on bond issuance for financing, and the Bank of Japan's continued purchases of ultra-long-term bonds through regular bond-buying operations.
From a microeconomic perspective, the 30-year Japanese government bond yield fell below 3.40% and briefly dipped to 3.395%, with price volatility amplified by insufficient liquidity. This trend has two implications for the US Treasury market: First, core developed markets globally still have demand for long-term bonds, which corroborates the recent Wall Street Journal's observation that "bond demand is difficult to meet, and the scarcity of long-term bonds is driving narrowing yield spreads." Second, if the flattening of the Japanese bond yield curve reflects a reassessment of market expectations for marginal tightening by the Bank of Japan, then the potential impact of carry trade unwinding on the USD/JPY exchange rate and US Treasury holdings should be closely monitored.
The USD/JPY pair is currently trading at 153.11, with market discussions about "buying Japan" intensifying and the yen heading for its best weekly performance in a year. If the upward pressure on the yen continues, it could weaken the hedging returns of overseas investors in US Treasuries to some extent, thereby affecting their marginal allocation intentions.
Based on a comprehensive technical analysis and cross-market signals, the core trading range for the 10-year US Treasury yield in the next 1-2 trading days can be defined as 4.124%-4.218%. The lower limit of this range is formed by this week's low and the lower Bollinger Band, while the upper limit corresponds to the resistance of the 50-day moving average (MA50). If this range is broken, the next areas to watch are the psychological level of 4.100% and the resistance zone of 4.240%-4.280%.
During trading, pay close attention to the following technical signals: First, whether the MACD indicator can form a clear golden cross to confirm the validity of the bottom divergence signal; second, whether the Bollinger Bands widen again, reflecting a restart of volatility; and third, the volatility characteristics of the 2s/10s and 5s/30s spread curves. Currently, the 5s/30s spread is consolidating around 106.7bp, having previously fallen from a high of 113.5bp to 103bp before finding support. A widening spread usually corresponds to a recovery in growth expectations, while a narrowing spread reflects a rise in risk aversion.
Furthermore, statements from Federal Reserve officials, particularly those seen by the market as potential successors to the Fed chairmanship, along with the continued strong employment in the healthcare sector and the structural changes in the US labor market reflected in the significant downward revision of overall employment data, will continue to be macroeconomic drivers of yield fluctuations. As the market awaits new catalysts, the effectiveness of technical levels will be amplified, and the repeated testing and defense of the 4.124%-4.164% area will be the most direct pricing reflection of short-term market sentiment.
Technical signals point to a short-term equilibrium, and yields are facing a directional choice.
Observing the 240-minute candlestick chart, the 10-year US Treasury yield, after reaching a high of 4.298% on January 20, has exhibited a "double top – pullback – low-level consolidation" pattern. After dipping to 4.124% on February 10, it rebounded slightly, and the current price is at 4.164%, highly converging with short-term and medium-term moving averages. This technical characteristic typically indicates that short-term market costs are converging, and the bullish and bearish forces are temporarily in a weak equilibrium.
The Bollinger Bands indicator shows the upper band at 4.240%, the lower band at 4.123%, and the middle band at 4.182%. The current yield is below the middle band, indicating that the short-term bearish trend has not yet reversed. It's worth noting that the Bollinger Bands have been narrowing since early February, and volatility has clearly contracted from previous highs, suggesting the market is awaiting a new catalyst to break the current consolidation. The MACD histogram has turned positive, and the DIFF and DEA lines are converging in the negative range, showing initial signs of bullish divergence, reflecting weakening bearish momentum. However, a clear golden cross signal has not yet formed, indicating that bulls still lack the willingness to actively push higher.
In terms of resistance structure, 4.218% is the location of the 50-day moving average (MA50), which, together with the previous small consolidation area of 4.220%-4.240%, forms the first resistance zone. If this area is broken, the double-top neckline near 4.280% will become a more crucial resistance test level. On the support side, 4.124% is the low point of this round of pullback, coinciding with the lower Bollinger Band at 4.123%, forming a support zone. The effectiveness of this area's defense will directly determine whether the yield will begin a new round of downward movement.
The dollar index faced renewed pressure, reducing the upside potential of US Treasury yields.
The 240-minute chart of the US dollar index shows that after hitting a low of 95.5625 on January 27th, the market rebounded to around 98.03, but then fell back to around 96.90 in early February, exhibiting a pattern of "decreasing rebound height and continued downward pressure." The current price of 96.9129 coincides perfectly with the short-term moving averages, but is significantly lower than the 50-day moving average (MA50) at 97.3026, indicating that the bearish trend has not fundamentally reversed.
The Bollinger Bands indicator also shows a narrowing channel with prices below the middle band, and volatility has clearly declined from its highs in late January. Notably, the US Dollar Index MACD has formed a golden cross in negative territory, with the DIFF line above the DEA line, contrasting somewhat with the bullish divergence signal on the US Treasury yield MACD. This technical divergence reflects that while the pricing logic of US dollar assets already incorporates some expectations of easing in the exchange rate, the bond market is still awaiting clearer policy signals for confirmation.
From a correlation perspective, the simultaneous decline in the US dollar index and US Treasury yields from mid to late January indicates that the dollar failed to effectively fulfill its safe-haven function during periods of heightened risk aversion. Conversely, since February, the dollar index has struggled to rebound, while US Treasury yields have remained low, exhibiting a low-level resonance between the two. A well-known institution believes that market expectations for a shift in Federal Reserve monetary policy are being repriced, a macroeconomic logic that is putting downward pressure on the dollar and limiting the upside potential of US Treasury yields.
The spillover effects of the flattening Japanese bond yield curve and the transmission of logic across markets.
The Japanese government bond market saw significant structural changes this week. While short-term yields weakened, with the 10-year yield rising to 2.235% at Tuesday's close, the 30-year yield fell sharply by 8 basis points to 3.42%, a new low since January 13. This flattening yield curve, characterized by stable short-term and declining long-term yields, was directly triggered by the Prime Minister's policy statement that the tax cut commitment would not rely on bond issuance for financing, and the Bank of Japan's continued purchases of ultra-long-term bonds through regular bond-buying operations.
From a microeconomic perspective, the 30-year Japanese government bond yield fell below 3.40% and briefly dipped to 3.395%, with price volatility amplified by insufficient liquidity. This trend has two implications for the US Treasury market: First, core developed markets globally still have demand for long-term bonds, which corroborates the recent Wall Street Journal's observation that "bond demand is difficult to meet, and the scarcity of long-term bonds is driving narrowing yield spreads." Second, if the flattening of the Japanese bond yield curve reflects a reassessment of market expectations for marginal tightening by the Bank of Japan, then the potential impact of carry trade unwinding on the USD/JPY exchange rate and US Treasury holdings should be closely monitored.
The USD/JPY pair is currently trading at 153.11, with market discussions about "buying Japan" intensifying and the yen heading for its best weekly performance in a year. If the upward pressure on the yen continues, it could weaken the hedging returns of overseas investors in US Treasuries to some extent, thereby affecting their marginal allocation intentions.
Yield range expectations and key intraday observation points
Based on a comprehensive technical analysis and cross-market signals, the core trading range for the 10-year US Treasury yield in the next 1-2 trading days can be defined as 4.124%-4.218%. The lower limit of this range is formed by this week's low and the lower Bollinger Band, while the upper limit corresponds to the resistance of the 50-day moving average (MA50). If this range is broken, the next areas to watch are the psychological level of 4.100% and the resistance zone of 4.240%-4.280%.
During trading, pay close attention to the following technical signals: First, whether the MACD indicator can form a clear golden cross to confirm the validity of the bottom divergence signal; second, whether the Bollinger Bands widen again, reflecting a restart of volatility; and third, the volatility characteristics of the 2s/10s and 5s/30s spread curves. Currently, the 5s/30s spread is consolidating around 106.7bp, having previously fallen from a high of 113.5bp to 103bp before finding support. A widening spread usually corresponds to a recovery in growth expectations, while a narrowing spread reflects a rise in risk aversion.
Furthermore, statements from Federal Reserve officials, particularly those seen by the market as potential successors to the Fed chairmanship, along with the continued strong employment in the healthcare sector and the structural changes in the US labor market reflected in the significant downward revision of overall employment data, will continue to be macroeconomic drivers of yield fluctuations. As the market awaits new catalysts, the effectiveness of technical levels will be amplified, and the repeated testing and defense of the 4.124%-4.164% area will be the most direct pricing reflection of short-term market sentiment.
- Risk Warning and Disclaimer
- The market involves risk, and trading may not be suitable for all investors. This article is for reference only and does not constitute personal investment advice, nor does it take into account certain users’ specific investment objectives, financial situation, or other needs. Any investment decisions made based on this information are at your own risk.