Gold prices fell sharply again ahead of the US CPI release, and are expected to continue their short-term correction.
2026-02-13 09:16:45
On Friday during Asian trading hours, spot gold (XAU/USD) continued its decline from the previous day, briefly falling to around $4910 before rebounding. This downturn was not an isolated event, but rather a concentrated sell-off triggered by macroeconomic data reinforcing expectations of high interest rates and tightening market liquidity.
Volatility in AI-related assets triggered a decline in market risk appetite, leading to a synchronized pullback across multiple asset classes. Meanwhile, some leveraged funds faced margin calls, and forced liquidations further exacerbated the gold price decline.
"Margin calls likely exacerbated the sell-off, forcing some investors to reduce their commodity positions, including precious metals, to replenish liquidity," said the head of metals strategy at MKS PAMP SA. On the macro front, according to data released by the U.S. Bureau of Labor Statistics, U.S. nonfarm payrolls increased by 130,000 in January, and the unemployment rate fell to 4.3%.

The resilience of the job market has weakened market bets on rapid interest rate cuts by the Federal Reserve, suppressing gold's performance from an interest rate perspective. Currently, the market is awaiting the US January CPI data. If inflation slows, gold may see a period of recovery; if inflation remains robust, high interest rate expectations may continue to dominate pricing.
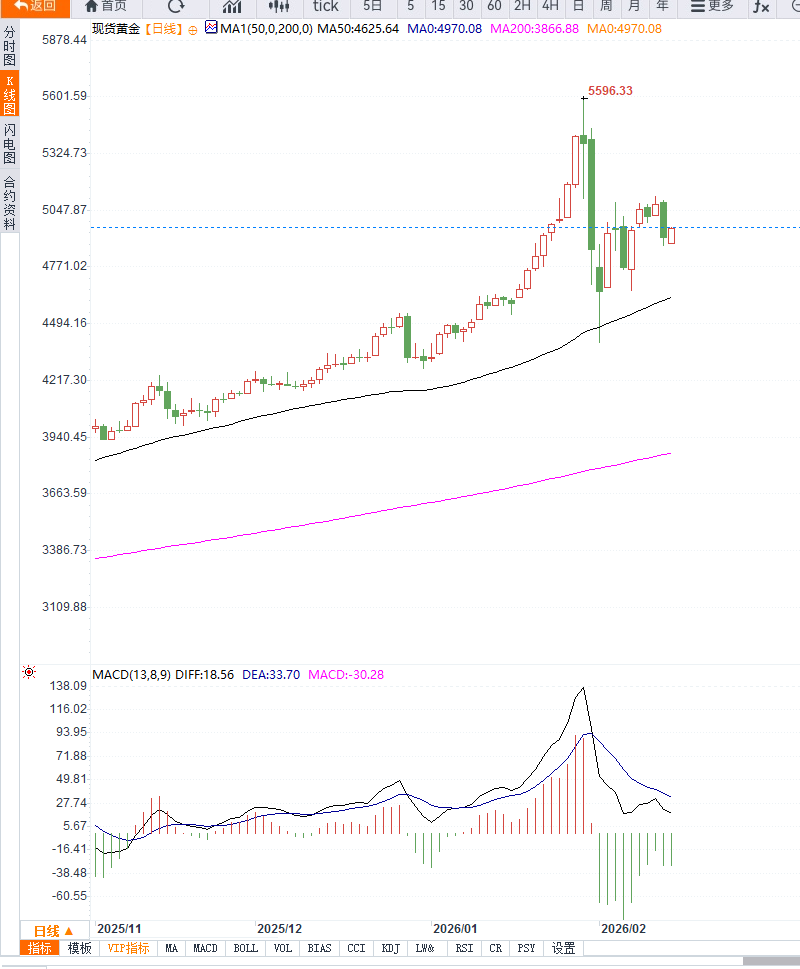
From a daily chart perspective, gold had previously been trading within an upward channel, but this single-day long bearish candle broke through short-term trend support, indicating that the previous strong momentum has been disrupted. The price quickly fell below the lower edge of the previous consolidation range, showing that bearish momentum has taken control in the short term.
The current price level around $4910 forms the first technical buffer, but the more crucial support level lies around $4880, which corresponds to the intersection of the previous densely traded area and the trend line. A break below this level could lead to a further test of the $4800 psychological level, which represents medium-term structural support.
Looking at the upside, $4980 becomes the first resistance level for a short-term rebound. If the rebound is limited and fails to hold, the downtrend will be difficult to reverse. Further key resistance lies around $5020; only by reclaiming this level can the market potentially resume its upward trend.
In terms of momentum indicators, the daily RSI has quickly fallen below 50, indicating a significant weakening of bullish momentum. The MACD histogram is also contracting and showing signs of a death cross, reinforcing the short-term pullback signal. The increased trading volume suggests that this round of decline has a certain degree of emotional venting rather than a gentle correction.
Overall, the technical outlook has shifted from a strong upward trend to a phase of high-level consolidation or even short-term correction. If there is a lack of positive fundamental support, gold prices may maintain a wide range of fluctuations.
Editor's Note:
The recent sharp drop in gold prices is essentially a result of the combined effects of liquidity and interest rate expectations. Employment data was merely the trigger; margin calls and quantitative easing amplified the market reaction. In the short term, gold's price movement will be entirely dependent on inflation data and expectations regarding the interest rate path.
If inflation unexpectedly weakens, gold prices could see technical correction; however, if inflation remains stubborn, the period of high-level consolidation may be prolonged. In the current highly volatile environment, controlling risk exposure is more important than predicting the direction.
Volatility in AI-related assets triggered a decline in market risk appetite, leading to a synchronized pullback across multiple asset classes. Meanwhile, some leveraged funds faced margin calls, and forced liquidations further exacerbated the gold price decline.
"Margin calls likely exacerbated the sell-off, forcing some investors to reduce their commodity positions, including precious metals, to replenish liquidity," said the head of metals strategy at MKS PAMP SA. On the macro front, according to data released by the U.S. Bureau of Labor Statistics, U.S. nonfarm payrolls increased by 130,000 in January, and the unemployment rate fell to 4.3%.
The resilience of the job market has weakened market bets on rapid interest rate cuts by the Federal Reserve, suppressing gold's performance from an interest rate perspective. Currently, the market is awaiting the US January CPI data. If inflation slows, gold may see a period of recovery; if inflation remains robust, high interest rate expectations may continue to dominate pricing.
From a daily chart perspective, gold had previously been trading within an upward channel, but this single-day long bearish candle broke through short-term trend support, indicating that the previous strong momentum has been disrupted. The price quickly fell below the lower edge of the previous consolidation range, showing that bearish momentum has taken control in the short term.
The current price level around $4910 forms the first technical buffer, but the more crucial support level lies around $4880, which corresponds to the intersection of the previous densely traded area and the trend line. A break below this level could lead to a further test of the $4800 psychological level, which represents medium-term structural support.
Looking at the upside, $4980 becomes the first resistance level for a short-term rebound. If the rebound is limited and fails to hold, the downtrend will be difficult to reverse. Further key resistance lies around $5020; only by reclaiming this level can the market potentially resume its upward trend.
In terms of momentum indicators, the daily RSI has quickly fallen below 50, indicating a significant weakening of bullish momentum. The MACD histogram is also contracting and showing signs of a death cross, reinforcing the short-term pullback signal. The increased trading volume suggests that this round of decline has a certain degree of emotional venting rather than a gentle correction.
Overall, the technical outlook has shifted from a strong upward trend to a phase of high-level consolidation or even short-term correction. If there is a lack of positive fundamental support, gold prices may maintain a wide range of fluctuations.
Editor's Note:
The recent sharp drop in gold prices is essentially a result of the combined effects of liquidity and interest rate expectations. Employment data was merely the trigger; margin calls and quantitative easing amplified the market reaction. In the short term, gold's price movement will be entirely dependent on inflation data and expectations regarding the interest rate path.
If inflation unexpectedly weakens, gold prices could see technical correction; however, if inflation remains stubborn, the period of high-level consolidation may be prolonged. In the current highly volatile environment, controlling risk exposure is more important than predicting the direction.
- Risk Warning and Disclaimer
- The market involves risk, and trading may not be suitable for all investors. This article is for reference only and does not constitute personal investment advice, nor does it take into account certain users’ specific investment objectives, financial situation, or other needs. Any investment decisions made based on this information are at your own risk.