Institutional analysis of the gold and silver price plunge: algorithm-driven selling; long-term support logic for gold remains unchanged.
2026-02-13 19:03:00
On Friday (February 13), spot gold rebounded sharply by 4.7% and spot silver by 4.6% during the Asian and European sessions, with bulls showing strength from the open. However, looking back to 23:59 on Thursday night, the market was in a completely opposite situation, with spot gold and spot silver both plunging at the same time. Silver fell by as much as 11% and gold by 4%. This article provides a more in-depth analysis in the VIP section, revealing a series of trading opportunities.

The following are the mainstream views based on fundamentals:
Spot gold weakened in early trading on Thursday, with the stabilization and rebound of the US dollar index being the core factor suppressing the market as it continued to digest the much stronger-than-expected US non-farm payroll data.
The non-farm payroll data significantly exceeded expectations, directly cooling market expectations for a Fed rate cut in March and causing the consensus on a June rate cut to weaken.
Geopolitical risks have temporarily taken a backseat this week, providing only long-term underlying support for gold prices. US economic data has become the core variable driving the direction of gold prices.
In recent months, the Federal Reserve has cited the slowdown in the job market as its core concern, believing that inflation will naturally decline.
However, at the interest rate meeting on January 27-28, Powell signaled a return to sticky inflation as the policy focus, and the market narrative completely shifted.
This makes the January CPI data to be released on Friday the most crucial juncture in the market's pricing of the Fed's interest rate path. If the CPI data, like the non-farm payrolls, significantly exceeds expectations, the volatility of gold and the US dollar will intensify dramatically.
Current market consensus still points to a rate cut in June. If the CPI data is higher than the market consensus of 2.5%, the window for the first rate cut in 2026 may be postponed to September. This would directly drive the US dollar to strengthen significantly, and gold prices would fall back to recent lows.
Conversely, if the CPI data meets or even falls short of expectations, expectations for interest rate cuts will be restored, and gold prices are expected to break free from short-term pressure.
Michael Power, a macro strategist at Bloomberg MLIV, characterized the volatility as a systemic sell-off, not driven by deteriorating fundamentals.
He stated that the risk aversion atmosphere triggered by the abnormal movement in the AI sector continued to spread in the stock market, and the sudden plunge in precious metals was essentially an algorithm-driven sell-off, with an overall cliff-like decline, consistent with the momentum-driven deleveraging characteristics of CTA institutions after the key support level was broken.
The sharp decline in precious metals is unrelated to changes in fundamental logic. Even though some market opinions interpret it as a delayed reaction to Wednesday's better-than-expected employment data, this explanation is not valid based on the timing and pattern of the sell-off.
The Federal Reserve's policies are only one of the drivers of the long-term bull market in gold. Even if there is short-term pressure, for long-term bulls who track central bank gold purchases, a pullback to the support range actually presents an opportunity to buy.
Before the job market and inflation expectations resonate, market disagreements about the timing and frequency of Fed rate cuts will continue for several months. In the short term, gold will maintain a volatile and oscillating pattern with intensified battles between bulls and bears. Friday's CPI data will be a key catalyst guiding the next direction of gold prices.
From a technical perspective, spot gold prices have found strong support at the lower channel line and have now returned to the 0.618 Fibonacci retracement level of this upward wave, remaining in a strong range. At the same time, pay attention to the important level of 5125, which is a significant resistance level for gold and a watershed between bullish and bearish sentiment.
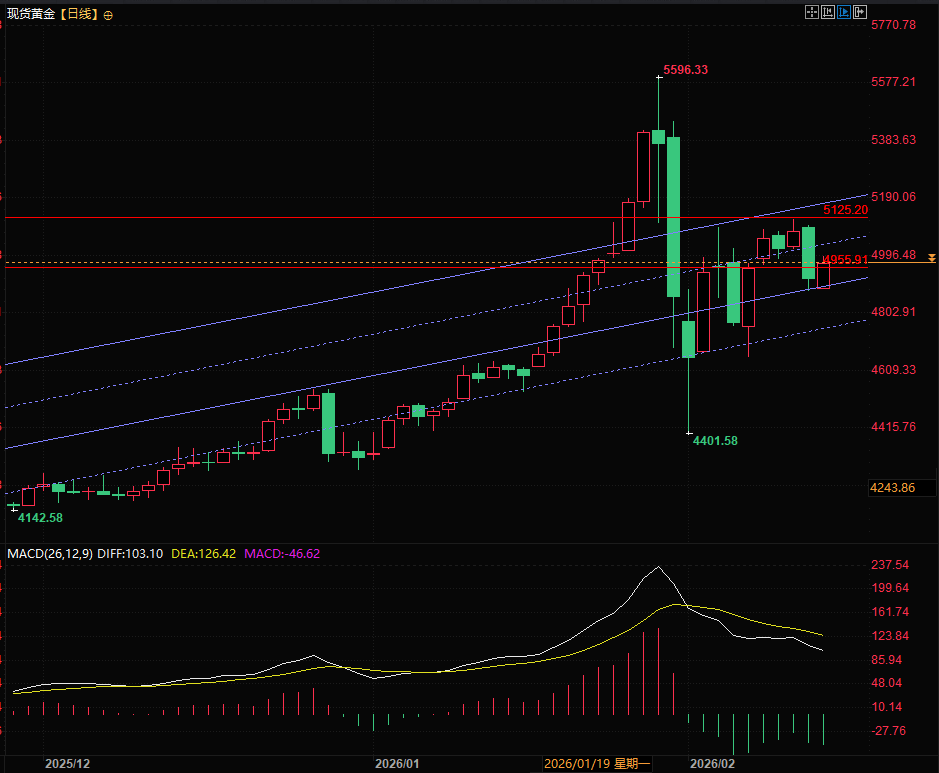
(Spot gold daily chart, source: FX678)
At 19:00 Beijing time, spot gold is currently trading at $4,945 per ounce.
The following are the mainstream views based on fundamentals:
Strong non-farm payroll data coupled with a rebounding dollar will put short-term pressure on gold prices.
Spot gold weakened in early trading on Thursday, with the stabilization and rebound of the US dollar index being the core factor suppressing the market as it continued to digest the much stronger-than-expected US non-farm payroll data.
The non-farm payroll data significantly exceeded expectations, directly cooling market expectations for a Fed rate cut in March and causing the consensus on a June rate cut to weaken.
Geopolitical risks have temporarily taken a backseat this week, providing only long-term underlying support for gold prices. US economic data has become the core variable driving the direction of gold prices.
The Fed's policy shift has brought inflation back into focus.
In recent months, the Federal Reserve has cited the slowdown in the job market as its core concern, believing that inflation will naturally decline.
However, at the interest rate meeting on January 27-28, Powell signaled a return to sticky inflation as the policy focus, and the market narrative completely shifted.
This makes the January CPI data to be released on Friday the most crucial juncture in the market's pricing of the Fed's interest rate path. If the CPI data, like the non-farm payrolls, significantly exceeds expectations, the volatility of gold and the US dollar will intensify dramatically.
CPI becomes a key watershed, with interest rate cut expectations influencing the direction of gold prices.
Current market consensus still points to a rate cut in June. If the CPI data is higher than the market consensus of 2.5%, the window for the first rate cut in 2026 may be postponed to September. This would directly drive the US dollar to strengthen significantly, and gold prices would fall back to recent lows.
Conversely, if the CPI data meets or even falls short of expectations, expectations for interest rate cuts will be restored, and gold prices are expected to break free from short-term pressure.
Institutional Interpretation: Pure Systemic Selling, Unrelated to Fundamentals
Michael Power, a macro strategist at Bloomberg MLIV, characterized the volatility as a systemic sell-off, not driven by deteriorating fundamentals.
He stated that the risk aversion atmosphere triggered by the abnormal movement in the AI sector continued to spread in the stock market, and the sudden plunge in precious metals was essentially an algorithm-driven sell-off, with an overall cliff-like decline, consistent with the momentum-driven deleveraging characteristics of CTA institutions after the key support level was broken.
The sharp decline in precious metals is unrelated to changes in fundamental logic. Even though some market opinions interpret it as a delayed reaction to Wednesday's better-than-expected employment data, this explanation is not valid based on the timing and pattern of the sell-off.
Short-term volatility has intensified, but the long-term fundamentals still support gold prices.
The Federal Reserve's policies are only one of the drivers of the long-term bull market in gold. Even if there is short-term pressure, for long-term bulls who track central bank gold purchases, a pullback to the support range actually presents an opportunity to buy.
Before the job market and inflation expectations resonate, market disagreements about the timing and frequency of Fed rate cuts will continue for several months. In the short term, gold will maintain a volatile and oscillating pattern with intensified battles between bulls and bears. Friday's CPI data will be a key catalyst guiding the next direction of gold prices.
Technical Analysis:
From a technical perspective, spot gold prices have found strong support at the lower channel line and have now returned to the 0.618 Fibonacci retracement level of this upward wave, remaining in a strong range. At the same time, pay attention to the important level of 5125, which is a significant resistance level for gold and a watershed between bullish and bearish sentiment.
(Spot gold daily chart, source: FX678)
At 19:00 Beijing time, spot gold is currently trading at $4,945 per ounce.
- Risk Warning and Disclaimer
- The market involves risk, and trading may not be suitable for all investors. This article is for reference only and does not constitute personal investment advice, nor does it take into account certain users’ specific investment objectives, financial situation, or other needs. Any investment decisions made based on this information are at your own risk.