Amid the AI revolution, funds are pouring into the bond market, while gold is being "abandoned."
2026-02-13 20:54:53
On Friday (February 13), the pricing logic of global financial markets was undergoing a dramatic reset. This time, the trigger was not the traditional economic data falling short of expectations, but rather a "crisis of confidence" in the technology sector. Panic over artificial intelligence spread rapidly, triggering a chain reaction in algorithmic trading and leveraged positions. Safe-haven funds fled risky assets at any cost, flocking to the US Treasury market for refuge.

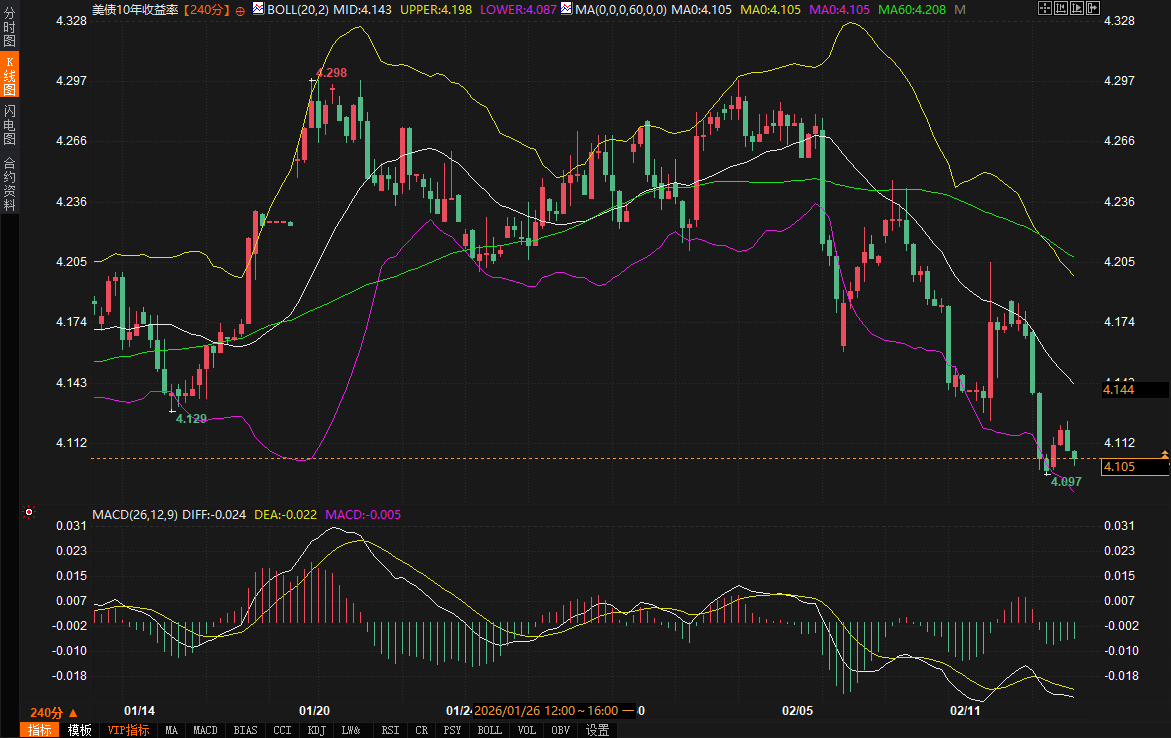
This sudden "AI cold wave" completely disrupted the original rhythm of US Treasury yields. Long-term yields, already under pressure after strong non-farm payroll data, reversed course and fell due to the massive influx of safe-haven funds. Technically, the US 10-year yield on the 240-minute chart showed a breakdown, with prices rapidly falling from a high of 4.298% to around 4.105%, breaking through two key support levels: the Bollinger Band middle line (4.143%) and the 60-day moving average (4.208%). Although the MACD indicator's DIFF and DEA lines are still in negative territory below the zero line (-0.024, -0.022), the continued shrinking of the histogram indicates that the downward momentum driven by short sellers is weakening, and the market's bullish and bearish forces have entered a brief period of weak equilibrium at the current level (close to the previous low of 4.112%).
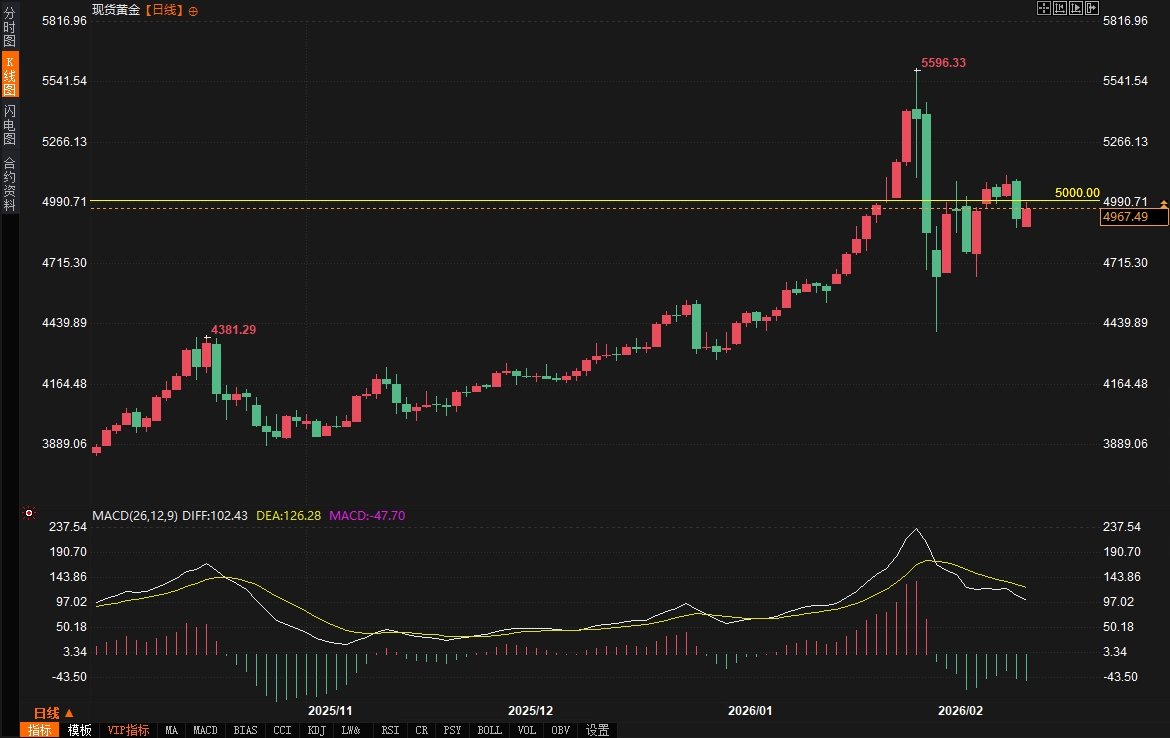
In stark contrast to the "safe haven" status of US Treasury bonds, gold, a traditional safe-haven asset, has experienced a dramatic rollercoaster ride during this period of turmoil. On Thursday (February 12), spot gold suffered a severe sell-off, falling by more than 3% in a single day, briefly breaking through the $5,000/ounce mark, and hitting a low of $4,878. This rare divergence between the performance of stocks, bonds, currencies, and gold reveals that the core contradiction in the market is not simply macroeconomic risk aversion, but rather an extreme liquidity crunch.
As market analysts have pointed out, when AI panic triggered a tech stock sell-off, some leveraged funds were forced to sell their previously profitable and highly liquid gold positions to obtain margin in order to offset stock market losses. The resonance of algorithmic trading models further amplified this volatility. Analysts at Capital Economics also observed that while bargain hunting from Asian markets drove a rapid rebound in gold prices, this was more like a technical correction to the panic selling than a trend reversal.
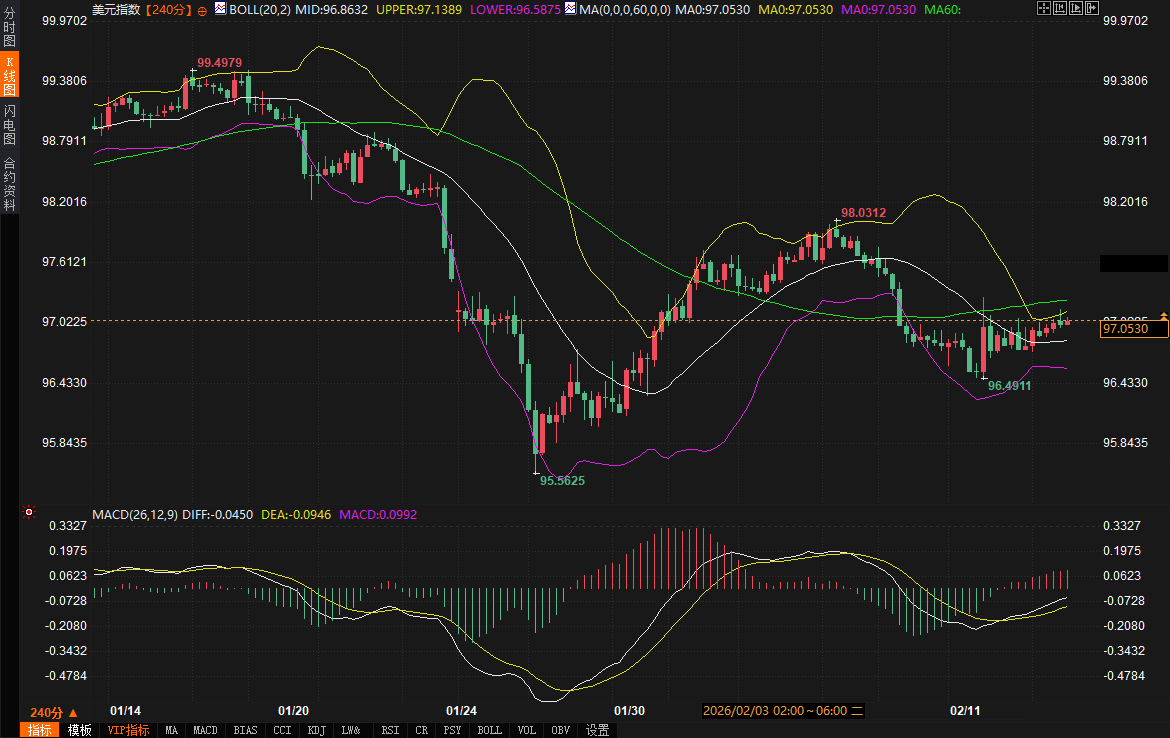
Against this backdrop, the dollar's trajectory appears relatively independent and intriguing. The 240-minute candlestick chart shows the dollar index has recently exhibited a fluctuating upward trend, currently hovering around 97.1580, attempting to challenge the upper limit of the range formed by previous highs. Technically, the Bollinger Bands have widened again after narrowing, the MACD histogram has turned positive, and the DEA has crossed above the DIF to form a golden cross—all signals suggesting strengthening short-term dollar momentum. This reflects a subtle shift in market pricing logic: despite rising risk aversion, the relative advantage of US economic growth compared to economies like Europe (the Eurozone's fourth-quarter GDP annualized rate was only 1.3%) remains, meaning the dollar hasn't completely lost its position in the game between "safe haven" and "relative interest rate differentials." Of course, some institutions believe that the policy divergence between the Federal Reserve and other major central banks (such as Japan and Australia) may still exert long-term pressure on the dollar throughout the year.
The market's focus is now heavily on the US January Consumer Price Index (CPI) report to be released tonight. Due to the previous government shutdown, this data is highly anticipated and widely seen as the only way to break the current stalemate. The mainstream market expectation is that the January CPI annual rate will fall from 2.7% to 2.5%, and the core CPI annual rate will also slow to 2.5%. If the data meets or falls short of expectations, it will directly correct the losses incurred by bets on interest rate cuts due to last week's strong non-farm payrolls, providing a respite for assets such as gold. Conversely, if inflation remains stubbornly high, it could reinforce expectations of continued high interest rates, exacerbating market volatility.
Looking ahead, the US Treasury market is no longer simply a game of interest rates; its trends are increasingly embedded in the complex narrative of global capital's confidence in dollar assets. Notably, amidst market turmoil, yesterday's 30-year US Treasury auction recorded record end-user demand, with the bid-to-cover ratio reaching its highest level since 2014. This seems to suggest that for long-term investors, current US Treasury yields offer investment value. However, whether this "buying" behavior stems from a "hedge against the US" strategy to mitigate economic risks or from an optimistic bet on the US economic outlook remains highly controversial. In the short term, market direction will be determined by tonight's inflation data, but in the medium to long term, the expansion of the US fiscal deficit, the debt ceiling issue, and the trend towards a multipolar global reserve currency system will all hang like a Damocles' sword over US Treasury bonds.
This sudden "AI cold wave" completely disrupted the original rhythm of US Treasury yields. Long-term yields, already under pressure after strong non-farm payroll data, reversed course and fell due to the massive influx of safe-haven funds. Technically, the US 10-year yield on the 240-minute chart showed a breakdown, with prices rapidly falling from a high of 4.298% to around 4.105%, breaking through two key support levels: the Bollinger Band middle line (4.143%) and the 60-day moving average (4.208%). Although the MACD indicator's DIFF and DEA lines are still in negative territory below the zero line (-0.024, -0.022), the continued shrinking of the histogram indicates that the downward momentum driven by short sellers is weakening, and the market's bullish and bearish forces have entered a brief period of weak equilibrium at the current level (close to the previous low of 4.112%).
In stark contrast to the "safe haven" status of US Treasury bonds, gold, a traditional safe-haven asset, has experienced a dramatic rollercoaster ride during this period of turmoil. On Thursday (February 12), spot gold suffered a severe sell-off, falling by more than 3% in a single day, briefly breaking through the $5,000/ounce mark, and hitting a low of $4,878. This rare divergence between the performance of stocks, bonds, currencies, and gold reveals that the core contradiction in the market is not simply macroeconomic risk aversion, but rather an extreme liquidity crunch.
As market analysts have pointed out, when AI panic triggered a tech stock sell-off, some leveraged funds were forced to sell their previously profitable and highly liquid gold positions to obtain margin in order to offset stock market losses. The resonance of algorithmic trading models further amplified this volatility. Analysts at Capital Economics also observed that while bargain hunting from Asian markets drove a rapid rebound in gold prices, this was more like a technical correction to the panic selling than a trend reversal.
Against this backdrop, the dollar's trajectory appears relatively independent and intriguing. The 240-minute candlestick chart shows the dollar index has recently exhibited a fluctuating upward trend, currently hovering around 97.1580, attempting to challenge the upper limit of the range formed by previous highs. Technically, the Bollinger Bands have widened again after narrowing, the MACD histogram has turned positive, and the DEA has crossed above the DIF to form a golden cross—all signals suggesting strengthening short-term dollar momentum. This reflects a subtle shift in market pricing logic: despite rising risk aversion, the relative advantage of US economic growth compared to economies like Europe (the Eurozone's fourth-quarter GDP annualized rate was only 1.3%) remains, meaning the dollar hasn't completely lost its position in the game between "safe haven" and "relative interest rate differentials." Of course, some institutions believe that the policy divergence between the Federal Reserve and other major central banks (such as Japan and Australia) may still exert long-term pressure on the dollar throughout the year.
The market's focus is now heavily on the US January Consumer Price Index (CPI) report to be released tonight. Due to the previous government shutdown, this data is highly anticipated and widely seen as the only way to break the current stalemate. The mainstream market expectation is that the January CPI annual rate will fall from 2.7% to 2.5%, and the core CPI annual rate will also slow to 2.5%. If the data meets or falls short of expectations, it will directly correct the losses incurred by bets on interest rate cuts due to last week's strong non-farm payrolls, providing a respite for assets such as gold. Conversely, if inflation remains stubbornly high, it could reinforce expectations of continued high interest rates, exacerbating market volatility.
Looking ahead, the US Treasury market is no longer simply a game of interest rates; its trends are increasingly embedded in the complex narrative of global capital's confidence in dollar assets. Notably, amidst market turmoil, yesterday's 30-year US Treasury auction recorded record end-user demand, with the bid-to-cover ratio reaching its highest level since 2014. This seems to suggest that for long-term investors, current US Treasury yields offer investment value. However, whether this "buying" behavior stems from a "hedge against the US" strategy to mitigate economic risks or from an optimistic bet on the US economic outlook remains highly controversial. In the short term, market direction will be determined by tonight's inflation data, but in the medium to long term, the expansion of the US fiscal deficit, the debt ceiling issue, and the trend towards a multipolar global reserve currency system will all hang like a Damocles' sword over US Treasury bonds.
- Risk Warning and Disclaimer
- The market involves risk, and trading may not be suitable for all investors. This article is for reference only and does not constitute personal investment advice, nor does it take into account certain users’ specific investment objectives, financial situation, or other needs. Any investment decisions made based on this information are at your own risk.