War premium returns, oil prices rebound, WTI retests January high near $67.
2026-02-20 20:01:48
On Friday (February 20), during the European trading session, the crude oil market saw a slight decline, but overall prices remained near six-month highs, poised for their first weekly gain in three weeks. At 19:33 Beijing time, the specific quotes were as follows: Brent crude futures were at $71.39 per barrel, down 51 cents, or 0.7%; WTI crude was at $66.13 per barrel, down 27 cents, or 0.41%.
Looking at weekly performance, Brent crude oil has risen 5.6% so far this week, while WTI crude oil has risen 5.27%, highlighting the market's continued escalation in pricing in geopolitical risks. Oil prices are expected to maintain a strong overall trend in the short term, while the battle between bulls and bears is gradually intensifying. This article combines the latest market trends, market drivers, and technical analysis to provide a comprehensive reference for market participants.
Key drivers of recent oil price fluctuations
The core driver of current oil price volatility is geopolitical risk concerns stemming from the escalating tensions between the US and Iran. US President Donald Trump stated clearly on Thursday that "very bad things" would happen if Iran did not agree to limit its nuclear program, setting a 10-15 day deadline for Iran. This tough stance significantly exacerbated market panic and drove up war risk premiums.
Data shows that traders and investors have recently increased their purchases of Brent crude oil call options significantly, fully reflecting market expectations for further price increases. Furthermore, Iranian military activities have amplified market concerns – according to local news agencies, Iran plans to conduct joint naval exercises with Russia after temporarily closing the Strait of Hormuz for military drills.
As a key global oil transportation route, the Strait of Hormuz carries about 20% of the world's oil supply. Iran is separated from the oil-rich Arabian Peninsula by the strait. If a conflict breaks out in the region, it will directly restrict the flow of oil into the global market, thereby significantly pushing up oil prices. This is the core logic behind the market's continuous pricing of geopolitical risks.
Besides geopolitical factors, declining crude oil inventories also provided significant support for oil prices. According to a report released by the U.S. Energy Information Administration (EIA) on Thursday, U.S. crude oil inventories decreased by 9 million barrels, driven by increased refinery utilization and exports. This larger-than-expected decline further strengthened market expectations of a short-term supply tightening, offsetting some of the downward pressure from profit-taking.
Market divergence and risk warnings
While geopolitical risks and inventory-related factors support oil prices, multiple negative factors are limiting upside potential, leading to significant divergence between bulls and bears in the market. Priyanka Sachdeva, senior market analyst at Phillip Nova, points out that after multiple failed rounds of US-Iran nuclear negotiations, market focus has shifted to Middle East tensions, but investors are still debating whether this will trigger actual turmoil. Ole Hansen, head of commodity strategy at Saxo Bank, also stated that the market is awaiting a binary outcome in the US-Iran situation, with a strong wait-and-see attitude, and Friday is likely to see a neutral stance.
Specifically, the negative factors are mainly concentrated in three aspects: First, concerns about the Fed's interest rate trend. Recent Fed meeting minutes indicate that interest rates will remain stable, but if inflation remains high, further rate hikes cannot be ruled out. Rate hikes may suppress crude oil demand, thereby suppressing oil prices. Second, expectations of increased OPEC+ production. There are reports that OPEC is inclined to resume increasing oil production from April to alleviate concerns about tight supply. Third, long-term pressure from excess inventory. JPMorgan analysts pointed out that the oil surplus situation since the second half of 2025 is still continuing and is likely to continue. In the long term, a reduction of 2 million barrels per day in production is needed to avoid excessive inventory accumulation by 2027.
It is important to note that betting on geopolitical events inherently involves high uncertainty and high risk. Historical experience shows that without concrete developments, oil prices are prone to decline due to exhaustion of upward momentum and profit-taking. The current slight decline in crude oil prices is a concrete manifestation of this market characteristic. For market participants, anticipating geopolitically driven oil price fluctuations requires a focus on entry points and risk control; these are the core elements for achieving long-term stable trading.
Reference for the probability of a US strike against Iran
Based on data from Polymarket's forecast market as of February 19, 2026, the probability of the United States launching a strike against Iran before February 28 is less than 30%, while the probability of a strike before the end of March remains at around 60%. This change in probability is highly consistent with the current pace of escalation in the US-Iran situation, further confirming the market's pricing logic for geopolitical risks.
Given the current market situation, WTI crude oil has declined slightly. While this still reflects market expectations for potential geopolitical events over the weekend to some extent, profit-taking and various negative factors continue to exert their influence, making a short-term correction highly likely. Furthermore, the exact timing of these geopolitical events remains difficult to predict. Against this backdrop, the following analysis will use multi-timeframe technical analysis to identify key trading levels for WTI crude oil, helping market participants improve their trading odds.
Technical Analysis
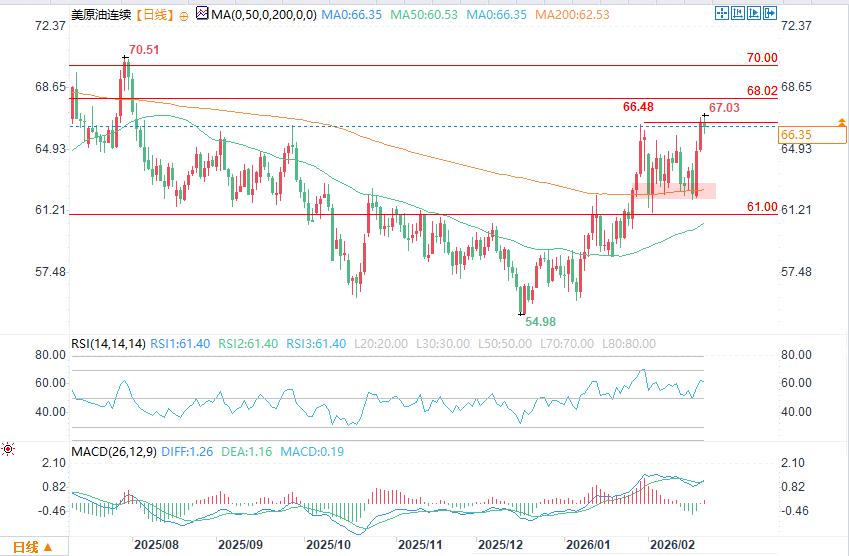
(WTI crude oil daily chart source: FX678)
WTI crude oil failed to hold above the January 29 high and is currently trading around $66.30, without a valid breakout (requiring the 1-hour candlestick to close above the high), highlighting the intense short-term battle between bulls and bears. Oil prices are currently significantly above the 200-day moving average (a key indicator of war risk premium) and are expected to remain above this moving average (±$0.50) in the short term.
Market trend forecast (based on the latest market dynamics):
If tensions between the US and Iran escalate and positive inventory levels continue to rise, oil prices could potentially test the $67.50–$68 resistance level. However, caution is advised regarding potential pressure from interest rates and increased OPEC+ production.
If a geopolitical conflict breaks out and the Strait of Hormuz is blocked, oil prices will quickly break through $70 and head towards the $75-$80 range.
Without geopolitical news and with rising concerns about negative factors, oil prices are likely to retrace to the 200-day moving average ($62.83), which would be the optimal entry point.
The daily closing price fell below $61, indicating large-scale liquidation and suggesting that oil prices may be entering a period of adjustment. Coupled with long-term oversupply pressure, the downside potential is widening.
WTI 4-hour chart and key technical levels
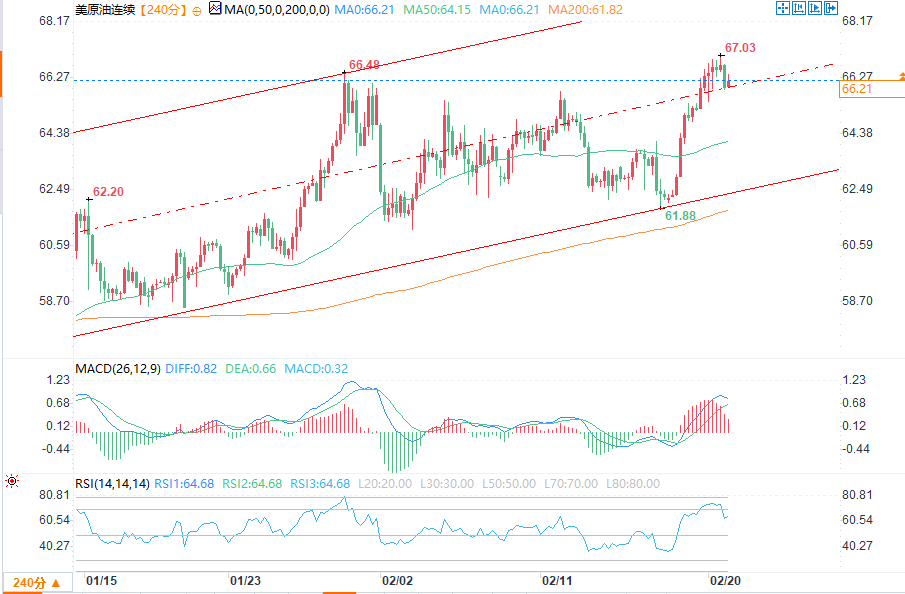
(WTI 4-hour chart source: EasyTrade)
Short-term oil price movements are complex. The RSI overbought condition, coupled with profit-taking, has driven a slight decline. The bullish hammer pattern on the 4-hour chart failed to hold, indicating increased divergence among investors and weakening bullish momentum, which is highly consistent with the current mixed bullish and bearish landscape.
Without geopolitical events, oil prices are likely to continue their pullback, providing an opportunity to enter the market on the dip; if key support holds and geopolitical positive factors take effect, the 4-hour bullish channel targets $69.
Current oil prices are hovering near the highs reached at the end of January, with the RSI in overbought territory, suggesting a high probability of a short-term pullback. Aggressive traders could consider entering on a pullback at two levels: $65 (extremely aggressive, reflecting expectations of weekend intervention) and $64 (relatively conservative, suitable for high-risk participants). If no geopolitical events occur, the key support/resistance level of $62.00–$63.40 should be monitored.
Looking at weekly performance, Brent crude oil has risen 5.6% so far this week, while WTI crude oil has risen 5.27%, highlighting the market's continued escalation in pricing in geopolitical risks. Oil prices are expected to maintain a strong overall trend in the short term, while the battle between bulls and bears is gradually intensifying. This article combines the latest market trends, market drivers, and technical analysis to provide a comprehensive reference for market participants.
Key drivers of recent oil price fluctuations
The core driver of current oil price volatility is geopolitical risk concerns stemming from the escalating tensions between the US and Iran. US President Donald Trump stated clearly on Thursday that "very bad things" would happen if Iran did not agree to limit its nuclear program, setting a 10-15 day deadline for Iran. This tough stance significantly exacerbated market panic and drove up war risk premiums.
Data shows that traders and investors have recently increased their purchases of Brent crude oil call options significantly, fully reflecting market expectations for further price increases. Furthermore, Iranian military activities have amplified market concerns – according to local news agencies, Iran plans to conduct joint naval exercises with Russia after temporarily closing the Strait of Hormuz for military drills.
As a key global oil transportation route, the Strait of Hormuz carries about 20% of the world's oil supply. Iran is separated from the oil-rich Arabian Peninsula by the strait. If a conflict breaks out in the region, it will directly restrict the flow of oil into the global market, thereby significantly pushing up oil prices. This is the core logic behind the market's continuous pricing of geopolitical risks.
Besides geopolitical factors, declining crude oil inventories also provided significant support for oil prices. According to a report released by the U.S. Energy Information Administration (EIA) on Thursday, U.S. crude oil inventories decreased by 9 million barrels, driven by increased refinery utilization and exports. This larger-than-expected decline further strengthened market expectations of a short-term supply tightening, offsetting some of the downward pressure from profit-taking.
Market divergence and risk warnings
While geopolitical risks and inventory-related factors support oil prices, multiple negative factors are limiting upside potential, leading to significant divergence between bulls and bears in the market. Priyanka Sachdeva, senior market analyst at Phillip Nova, points out that after multiple failed rounds of US-Iran nuclear negotiations, market focus has shifted to Middle East tensions, but investors are still debating whether this will trigger actual turmoil. Ole Hansen, head of commodity strategy at Saxo Bank, also stated that the market is awaiting a binary outcome in the US-Iran situation, with a strong wait-and-see attitude, and Friday is likely to see a neutral stance.
Specifically, the negative factors are mainly concentrated in three aspects: First, concerns about the Fed's interest rate trend. Recent Fed meeting minutes indicate that interest rates will remain stable, but if inflation remains high, further rate hikes cannot be ruled out. Rate hikes may suppress crude oil demand, thereby suppressing oil prices. Second, expectations of increased OPEC+ production. There are reports that OPEC is inclined to resume increasing oil production from April to alleviate concerns about tight supply. Third, long-term pressure from excess inventory. JPMorgan analysts pointed out that the oil surplus situation since the second half of 2025 is still continuing and is likely to continue. In the long term, a reduction of 2 million barrels per day in production is needed to avoid excessive inventory accumulation by 2027.
It is important to note that betting on geopolitical events inherently involves high uncertainty and high risk. Historical experience shows that without concrete developments, oil prices are prone to decline due to exhaustion of upward momentum and profit-taking. The current slight decline in crude oil prices is a concrete manifestation of this market characteristic. For market participants, anticipating geopolitically driven oil price fluctuations requires a focus on entry points and risk control; these are the core elements for achieving long-term stable trading.
Reference for the probability of a US strike against Iran
Based on data from Polymarket's forecast market as of February 19, 2026, the probability of the United States launching a strike against Iran before February 28 is less than 30%, while the probability of a strike before the end of March remains at around 60%. This change in probability is highly consistent with the current pace of escalation in the US-Iran situation, further confirming the market's pricing logic for geopolitical risks.
Given the current market situation, WTI crude oil has declined slightly. While this still reflects market expectations for potential geopolitical events over the weekend to some extent, profit-taking and various negative factors continue to exert their influence, making a short-term correction highly likely. Furthermore, the exact timing of these geopolitical events remains difficult to predict. Against this backdrop, the following analysis will use multi-timeframe technical analysis to identify key trading levels for WTI crude oil, helping market participants improve their trading odds.
Technical Analysis
(WTI crude oil daily chart source: FX678)
WTI crude oil failed to hold above the January 29 high and is currently trading around $66.30, without a valid breakout (requiring the 1-hour candlestick to close above the high), highlighting the intense short-term battle between bulls and bears. Oil prices are currently significantly above the 200-day moving average (a key indicator of war risk premium) and are expected to remain above this moving average (±$0.50) in the short term.
Market trend forecast (based on the latest market dynamics):
If tensions between the US and Iran escalate and positive inventory levels continue to rise, oil prices could potentially test the $67.50–$68 resistance level. However, caution is advised regarding potential pressure from interest rates and increased OPEC+ production.
If a geopolitical conflict breaks out and the Strait of Hormuz is blocked, oil prices will quickly break through $70 and head towards the $75-$80 range.
Without geopolitical news and with rising concerns about negative factors, oil prices are likely to retrace to the 200-day moving average ($62.83), which would be the optimal entry point.
The daily closing price fell below $61, indicating large-scale liquidation and suggesting that oil prices may be entering a period of adjustment. Coupled with long-term oversupply pressure, the downside potential is widening.
WTI 4-hour chart and key technical levels
(WTI 4-hour chart source: EasyTrade)
Short-term oil price movements are complex. The RSI overbought condition, coupled with profit-taking, has driven a slight decline. The bullish hammer pattern on the 4-hour chart failed to hold, indicating increased divergence among investors and weakening bullish momentum, which is highly consistent with the current mixed bullish and bearish landscape.
Without geopolitical events, oil prices are likely to continue their pullback, providing an opportunity to enter the market on the dip; if key support holds and geopolitical positive factors take effect, the 4-hour bullish channel targets $69.
Current oil prices are hovering near the highs reached at the end of January, with the RSI in overbought territory, suggesting a high probability of a short-term pullback. Aggressive traders could consider entering on a pullback at two levels: $65 (extremely aggressive, reflecting expectations of weekend intervention) and $64 (relatively conservative, suitable for high-risk participants). If no geopolitical events occur, the key support/resistance level of $62.00–$63.40 should be monitored.
- Risk Warning and Disclaimer
- The market involves risk, and trading may not be suitable for all investors. This article is for reference only and does not constitute personal investment advice, nor does it take into account certain users’ specific investment objectives, financial situation, or other needs. Any investment decisions made based on this information are at your own risk.