


Crude oil quietly broke through a four-year consolidation range; how high can this round of ferrous metal price rebound go?
2026-02-25 17:29:34
Since the beginning of the year, the stock prices of US oil companies such as ExxonMobil and Chevron, as well as their European counterparts such as Total Energy and OMV, have risen sharply. Crude oil prices have also successfully broken through a technical wedge pattern that has lasted for four years, marking the official start of a new upward trend.
The core logic driving oil prices higher is diverse and robust, including long-term underinvestment in exploration and production capacity, extremely pessimistic market sentiment, and geopolitical competition, all of which constitute the core drivers of oil prices.
Core logic: Trump's "energy independence" plan (DrillBabyDrill)
It is the core action plan of Trump's 2026 energy strategy.
Its core logic is to propel the United States from simple energy self-sufficiency to global "energy dominance" through "extreme deregulation" and "massive supply." Unlike the restraint of the Biden era, this plan aims to break down all mining restrictions.
By artificially creating a risk premium through sanctions against Iran and intimidating Venezuela, oil prices are forcibly maintained at around $65, which is the "sweet spot" where shale oil can survive and voters won't complain.
This price ensures that US shale oil companies have sufficient cash flow to "drill freely" without triggering deadly inflation, thus completing the initial accumulation for US energy expansion.
However, Saudi Arabia has realized that if it maintains high prices by cooperating with production cuts, it is actually "paying wages" to US shale oil companies. As long as US oil companies dare to make large-scale forays into high-cost areas such as the Arctic, Saudi Arabia will immediately increase production and drive down oil prices.
Fortunately, in 2026, the capital expenditures of oil giants (such as Chevron and Exxon) were mainly directed towards Guyana and the core area of the Permian Basin, rather than responding to the call to drill in the Arctic.
The escalation of the standoff between the US and Iran has been the direct trigger for the recent surge in oil prices.
US crude oil has rebounded recently, breaking through the $65/barrel mark and reaching a new high since July 2025.
Behind this surge is the global uncertainty index rising to a historical peak, with risk premium levels far exceeding those of the COVID-19 pandemic, the 2008 global financial crisis, and the 2000 dot-com bubble.
The Trump administration gave Iran a clear 10-15 day window for negotiations, demanding that it abandon its nuclear program or face severe consequences. At the same time, it raised its military deployment in the Middle East to the highest level since the 2003 Iraq War, sending a strong deterrent signal.
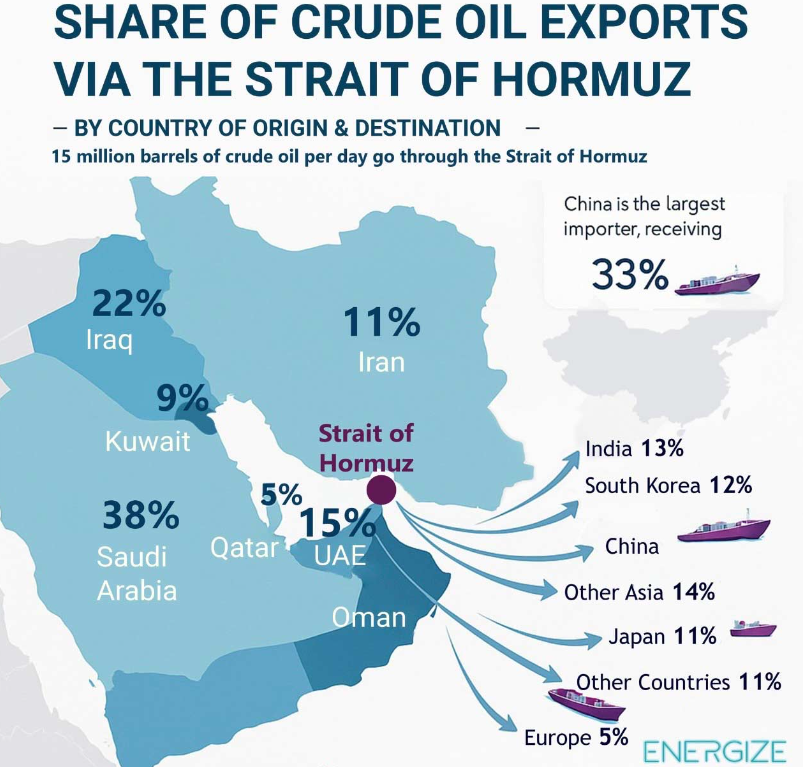
Meanwhile, Iran immediately launched armed drone exercises and briefly controlled part of the Strait of Hormuz, a waterway that carries 20% of global crude oil transportation and is the lifeline for Middle Eastern oil-producing countries' exports. Even a short-term disturbance was enough to trigger a jump in oil prices.
Russia has been calling for de-escalation while simultaneously conducting joint military exercises with Iran and providing it with modern long-range air defense systems for many years.
Despite Russia's technological support, it has not yet made a clear commitment to provide military protection during wartime. However, if Iran were to lose power, it would have a significant strategic impact on the international geopolitical situation.
As the United States intensifies military pressure, large-scale protests continue to spread across Iran, with citizens calling for an end to theocracy and greater freedom.
Internal instability may force the Iranian government to adopt a tougher diplomatic stance, consolidating its rule by demonstrating strength to the outside world, and further escalating the risk of regional conflict.
The financial and energy markets have adopted a "predictive" response pattern, with transportation insurance, freight rates, and forward curves reflecting supply disruption risks in advance, causing oil prices to rise before actual supply is affected.
From a valuation perspective, the current gold-oil ratio is approximately 79, meaning that 1 ounce of gold can be exchanged for 79 barrels of crude oil. This level is far above the historical average, implying that there is significant room for crude oil to recover relative to gold prices.
From a technical perspective, the gold-oil ratio shows a large cup and handle pattern, which is still favorable for gold prices in the long term. However, in the next few months to 1-3 years, crude oil is expected to outperform gold in stages.
Even if oil prices rise to $120 and the gold-oil ratio falls to 60, gold prices could still reach $7,200, but high oil prices will compress the profit margins of mining stocks.
The crude oil market has formed a triple driving logic of "geopolitical risk + supply and demand gap + valuation repair", which may lead to precious metals entering a medium- to long-term consolidation phase.
For investors, energy stocks and crude oil ETFs continue to become more attractive, while mining stocks should be wary of profit pressures from high energy costs.
With the oil market becoming increasingly politicized and precious metal prices in overbought territory, the energy sector, with its superior risk-reward ratio, is poised to become the core theme of the next market rally.
Looking back at the long-term trend, crude oil entered a long bear market after reaching a high of $147 per barrel in 2008. In 2014, the US shale oil revolution undermined OPEC's pricing power, and in 2020, the pandemic caused oil prices to fall into negative territory at one point.
Oil prices subsequently rebounded to $130, and entered a descending wedge consolidation pattern from February 2022 until recently completing an upward breakout.
After breaking out of its four-year trading range, the first target for oil prices is $70 per barrel. Based on price action and volume analysis, it is expected to further challenge $100 per barrel.
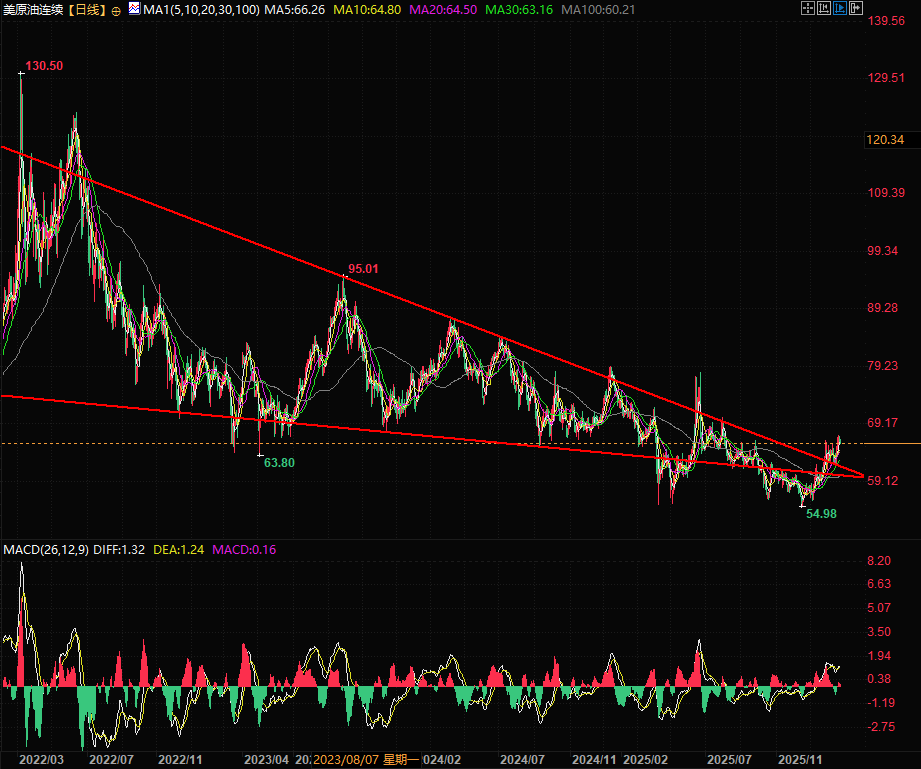
(US crude oil futures daily chart, source: FX678)
At 17:23 Beijing time, US crude oil futures were trading at $65.93 per barrel.
The core logic driving oil prices higher is diverse and robust, including long-term underinvestment in exploration and production capacity, extremely pessimistic market sentiment, and geopolitical competition, all of which constitute the core drivers of oil prices.
Core logic: Trump's "energy independence" plan (DrillBabyDrill)
It is the core action plan of Trump's 2026 energy strategy.
Its core logic is to propel the United States from simple energy self-sufficiency to global "energy dominance" through "extreme deregulation" and "massive supply." Unlike the restraint of the Biden era, this plan aims to break down all mining restrictions.
By artificially creating a risk premium through sanctions against Iran and intimidating Venezuela, oil prices are forcibly maintained at around $65, which is the "sweet spot" where shale oil can survive and voters won't complain.
This price ensures that US shale oil companies have sufficient cash flow to "drill freely" without triggering deadly inflation, thus completing the initial accumulation for US energy expansion.
However, Saudi Arabia has realized that if it maintains high prices by cooperating with production cuts, it is actually "paying wages" to US shale oil companies. As long as US oil companies dare to make large-scale forays into high-cost areas such as the Arctic, Saudi Arabia will immediately increase production and drive down oil prices.
Fortunately, in 2026, the capital expenditures of oil giants (such as Chevron and Exxon) were mainly directed towards Guyana and the core area of the Permian Basin, rather than responding to the call to drill in the Arctic.
Escalating US-Iran standoff triggers geopolitical risks and oil price surge
The escalation of the standoff between the US and Iran has been the direct trigger for the recent surge in oil prices.
US crude oil has rebounded recently, breaking through the $65/barrel mark and reaching a new high since July 2025.
Behind this surge is the global uncertainty index rising to a historical peak, with risk premium levels far exceeding those of the COVID-19 pandemic, the 2008 global financial crisis, and the 2000 dot-com bubble.
The Trump administration gave Iran a clear 10-15 day window for negotiations, demanding that it abandon its nuclear program or face severe consequences. At the same time, it raised its military deployment in the Middle East to the highest level since the 2003 Iraq War, sending a strong deterrent signal.
Meanwhile, Iran immediately launched armed drone exercises and briefly controlled part of the Strait of Hormuz, a waterway that carries 20% of global crude oil transportation and is the lifeline for Middle Eastern oil-producing countries' exports. Even a short-term disturbance was enough to trigger a jump in oil prices.
Russia has been calling for de-escalation while simultaneously conducting joint military exercises with Iran and providing it with modern long-range air defense systems for many years.
Despite Russia's technological support, it has not yet made a clear commitment to provide military protection during wartime. However, if Iran were to lose power, it would have a significant strategic impact on the international geopolitical situation.
Iran faces internal and external troubles, further highlighting its vulnerability in energy supply.
As the United States intensifies military pressure, large-scale protests continue to spread across Iran, with citizens calling for an end to theocracy and greater freedom.
Internal instability may force the Iranian government to adopt a tougher diplomatic stance, consolidating its rule by demonstrating strength to the outside world, and further escalating the risk of regional conflict.
The financial and energy markets have adopted a "predictive" response pattern, with transportation insurance, freight rates, and forward curves reflecting supply disruption risks in advance, causing oil prices to rise before actual supply is affected.
The gold-oil ratio is at a historical high, and crude oil is significantly undervalued.
From a valuation perspective, the current gold-oil ratio is approximately 79, meaning that 1 ounce of gold can be exchanged for 79 barrels of crude oil. This level is far above the historical average, implying that there is significant room for crude oil to recover relative to gold prices.
From a technical perspective, the gold-oil ratio shows a large cup and handle pattern, which is still favorable for gold prices in the long term. However, in the next few months to 1-3 years, crude oil is expected to outperform gold in stages.
Even if oil prices rise to $120 and the gold-oil ratio falls to 60, gold prices could still reach $7,200, but high oil prices will compress the profit margins of mining stocks.
Summary and Technical Analysis:
The crude oil market has formed a triple driving logic of "geopolitical risk + supply and demand gap + valuation repair", which may lead to precious metals entering a medium- to long-term consolidation phase.
For investors, energy stocks and crude oil ETFs continue to become more attractive, while mining stocks should be wary of profit pressures from high energy costs.
With the oil market becoming increasingly politicized and precious metal prices in overbought territory, the energy sector, with its superior risk-reward ratio, is poised to become the core theme of the next market rally.
Looking back at the long-term trend, crude oil entered a long bear market after reaching a high of $147 per barrel in 2008. In 2014, the US shale oil revolution undermined OPEC's pricing power, and in 2020, the pandemic caused oil prices to fall into negative territory at one point.
Oil prices subsequently rebounded to $130, and entered a descending wedge consolidation pattern from February 2022 until recently completing an upward breakout.
After breaking out of its four-year trading range, the first target for oil prices is $70 per barrel. Based on price action and volume analysis, it is expected to further challenge $100 per barrel.
(US crude oil futures daily chart, source: FX678)
At 17:23 Beijing time, US crude oil futures were trading at $65.93 per barrel.
- Risk Warning and Disclaimer
- The market involves risk, and trading may not be suitable for all investors. This article is for reference only and does not constitute personal investment advice, nor does it take into account certain users’ specific investment objectives, financial situation, or other needs. Any investment decisions made based on this information are at your own risk.
