Energy Triggers Bond Market Liquidation Storm: Is 99.70 the Dollar's Ceiling? Gold's 5050 Defense Line in Crisis
2026-03-09 20:36:49
On Monday (March 9th), global financial markets were at the center of a liquidity rebalancing storm triggered by sharp fluctuations in energy prices. Crude oil prices surged above $119 after news of high-level personnel changes in Iran, only to give back significantly after reports of G7 intervention from prominent institutions. Volatility in the bond and currency markets was pushed to extreme levels. The core driver of the current market is no longer simply inflation expectations, but a complex network interwoven with the liquidity premium of US Treasuries , the transmission of risk aversion , and policy divergences among global central banks .

In the current macroeconomic environment, the dollar's trajectory is highly anchored to the supply and liquidity structure of the US Treasury market. According to the latest market quotes, the general mortgage (GC) rate opened at a high of 3.69%, reflecting a clear "cash is king" tendency among funds within the system amidst a double sell-off in both the stock and bond markets. This liquidation logic has led to a large inflow of funds back into the money market, providing strong passive support for the dollar index.
From a fundamental perspective, the rise in US Treasury yields is not simply due to optimistic economic growth expectations, but rather to inflationary anxieties and deflationary pressures stemming from geopolitical risks . Renowned economists point out that the global economy is facing the threat of stagflation due to the turbulent situation in Iran and soaring energy costs. Meanwhile, the US Treasury market is about to witness a large-scale auction (including $89 billion in 13-week Treasuries and $77 billion in 26-week Treasuries), and with Bond Vigilantes making a comeback, the market's ability to absorb this record-breaking supply is being tested.
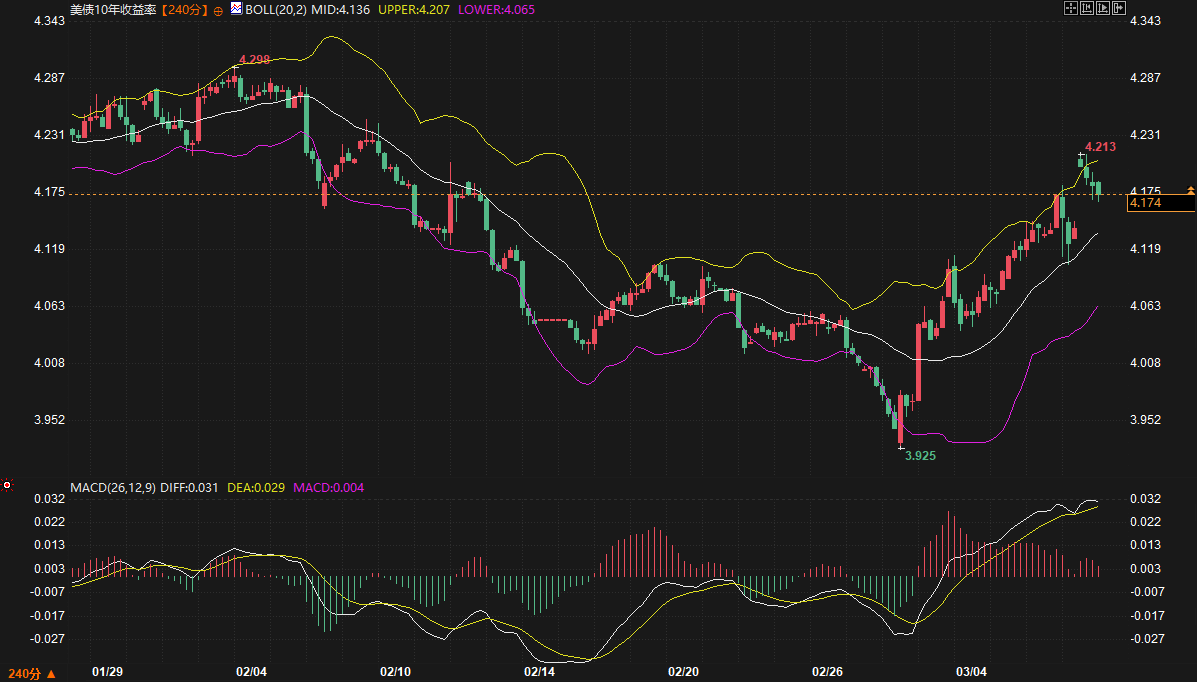
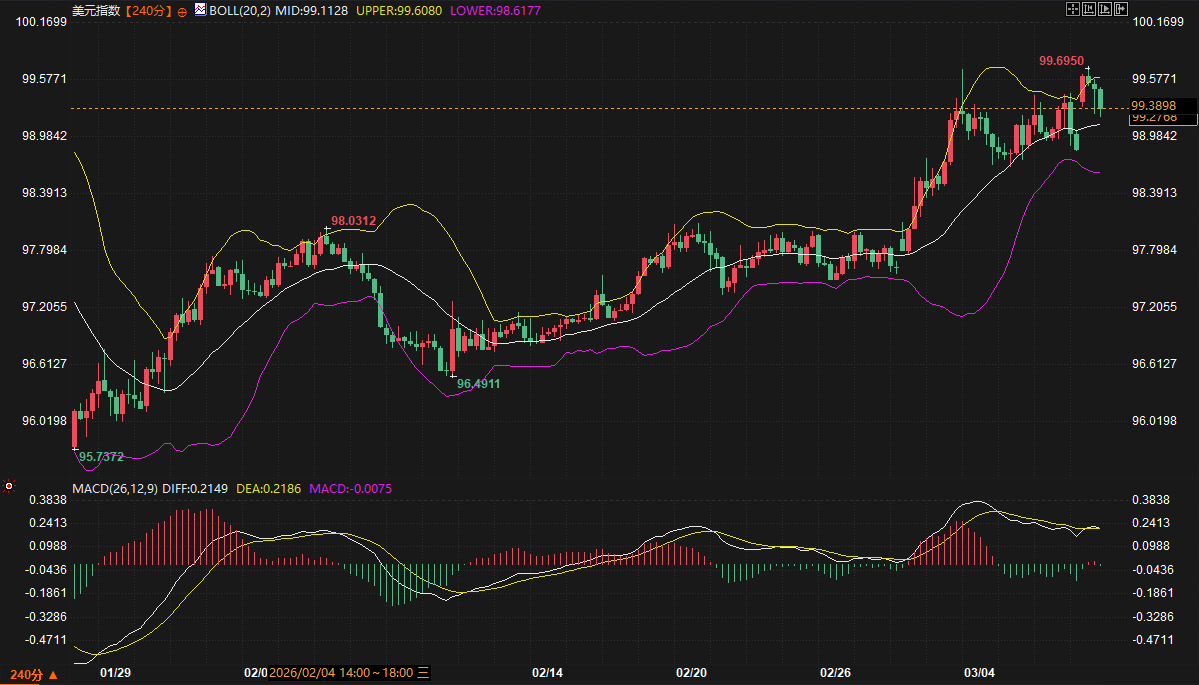
From a technical perspective, the US Dollar Index (DXY) is currently at 99.3898. Although it is in a pullback phase from its highs, it remains above the middle Bollinger Band. Notably, the 240-minute MACD indicator has shown a death cross signal, and the bullish momentum bars have completely converged. This suggests that after encountering selling pressure near 99.70, the dollar may retrace to the 99.00 level in the short term. The key to the dollar's resilience lies in the strength of US Treasury yields—the 10-year Treasury yield encountered strong resistance at the 200-day moving average near 4.21%, but as long as it remains above 4.13%, the dollar's valuation premium will be difficult to erase quickly.
Traditionally, rising US Treasury yields would suppress gold prices, but in the current turbulent times, the pricing logic for gold is undergoing a profound shift from being driven by real interest rates to being transmitted through the bond market as a safe haven .
Currently, spot gold is priced at around $5097.12 per ounce. Although it has retreated from its high in early March, the strong support it has shown around $5050 is essentially a safe-haven effect triggered by bond market turmoil. When the 10-year US Treasury yield rose rapidly, due to global investors' concerns about the stability of European and emerging market sovereign debt, funds did not entirely flow into safe-haven currencies, but remained partially in gold, an asset with no default risk .
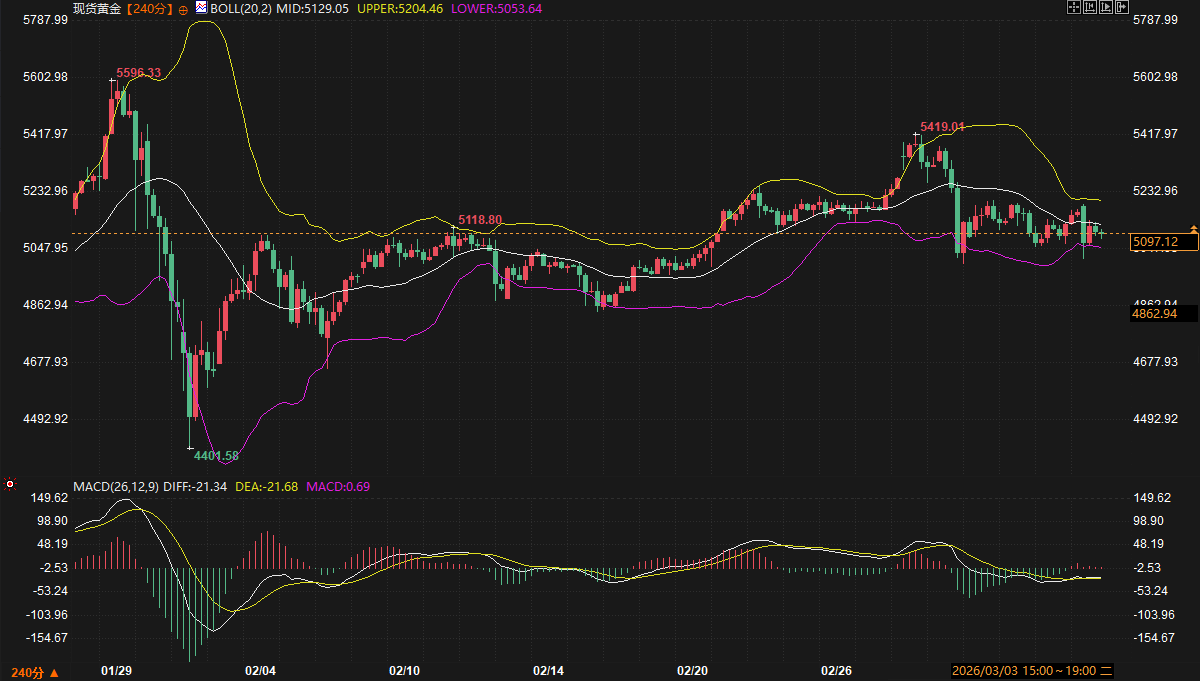
Energy spillover effects are another key variable in the gold market's logic. With high volatility in crude oil prices, market concerns about double-dip inflation have manifested not only in Europe (such as the surge in UK Gilt bond yields) but also prompted investors to seek gold as a safe-haven asset. Technically, the 240-minute chart for gold shows that its MACD fast and slow lines have flattened below the zero line, and the bearish momentum bars are continuously converging. This suggests that once the US dollar confirms a short-term top and declines, gold will take advantage of the temporary halt in the bond market sell-off to initiate a rebound based on geopolitical safe-haven recovery . Gold's current resistance levels are concentrated in the $5130 (Bollinger Band middle line) and $5200 range, while the bottom support logic is deeply rooted in safe-haven buying in the global credit market.
Looking ahead to the next 2-3 trading days, the market will enter a "post-pulse recovery period," but the volatility will remain at a high level.
1. 10-year US Treasury yield (refer to the main contract)
Support/resistance range : 4.136% — 4.240%
Range logic : There is dense selling pressure in the range of 4.21% (200-day moving average) to 4.24% above; the key short-term support is 4.136% (Bollinger Band middle line) below.
Key focus during trading : The New York Fed's consumer expectations survey, to be released tonight, warrants attention. If inflation expectations unexpectedly rise, yields could retest the 4.24% high, potentially putting further downward pressure on risk assets.
2. US Dollar Index
Support/resistance range : 99.00 — 99.70
Range logic : The MACD death cross confirms the short-term downward momentum. 99.00, as a psychological level, coincides with the lower Bollinger Band, providing strong support. Multiple attempts to break through and subsequent pullbacks near 99.70 constitute a medium-term technical ceiling.
Key points to watch during trading : Pay attention to the strength of the rebound in non-US currencies (especially the euro and Swiss franc) after the decline in energy prices, as this will directly affect the depth of the DXY correction through cross-currency pairs.
3. Spot Gold
Support/resistance range : $5053 - $5204
Range Logic : The $5050 range has proven to be a resilient support level over the past 10 trading days. If it can hold above $5130 today, it will have the momentum to challenge the upper Bollinger Band ($5204).
Key focus during trading : Will crude oil prices fill the gap between $96.25 and $92.61? If energy prices fall rapidly, gold's inflation-hedging premium may shrink; in that case, it will be necessary to observe whether safe-haven buying in the bond market can offset this negative impact.
The current market dynamics are in a highly sensitive vacuum. On the one hand, long-term inflationary concerns stemming from tariff rhetoric persist; on the other hand, fears of short-term energy supply disruptions have eased somewhat following signals of G7 intervention. In the next 48 hours, investors should closely monitor the performance of US Treasury yields around the 4.21% level. If yields fail to break through further upwards, a temporary peak in the dollar will provide valuable breathing room for gold. However, as economists have warned, the risk of a revaluation in the private credit market remains, and any signs of tightening liquidity could reignite the market's thirst for cash, thus limiting the potential upside for gold.
Q1: Why do large fluctuations in crude oil prices directly transmit to the US dollar's trend through the US Treasury market?
A: This transmission mainly occurs through two paths: First, the "inflation expectation" path. As the mother of all commodities, the surge in crude oil prices pushes up break-even inflation, thereby increasing nominal US Treasury yields and enhancing the attractiveness of the US dollar. Second, the "safe-haven liquidity" path. When the energy war escalates, global investors develop pessimistic expectations for non-US economies (especially Europe, which is highly dependent on imports), and funds flow into the US Treasury market for safety reasons. If the bond market experiences a sell-off due to oversupply, the rising yields will further increase the funding costs of the US dollar, reinforcing its strong position.
Q2: How should we understand the "bond market safe-haven effect" mentioned in the article? Why didn't gold fall sharply along with the rise in US Treasury yields?
A: In normal cycles, US Treasury yields and gold are negatively correlated; however, in a crisis scenario, they may rise together. The core logic behind the current strength of gold is "hedging against systemic risk." When the US Treasury market itself fluctuates due to liquidity shortages (such as rising GC rates) or credit risk premiums (such as the turmoil in the UK and French bond markets), investors no longer consider bonds to be absolutely safe. At this time, gold's attribute as the "ultimate safe-haven asset" is activated. As long as the safe-haven premium caused by geopolitical situations exceeds the holding cost brought about by rising real interest rates, gold can maintain a generally strong upward trend.
Q3: How to interpret the current MACD death cross signal of the US dollar index from a technical perspective?
A: A MACD death cross on the 240-minute chart typically indicates a temporary exhaustion in a medium-term uptrend. This means the one-sided upward movement supported by geopolitical fears in the past few weeks may have come to an end, and the market is entering a period of high-level consolidation. Considering the support level of the Bollinger Band middle line at 99.11, this death cross is more of a "time-for-space" oscillation and pullback than a trend reversal. It sends a signal to the market: barring more extreme news, the area around 99.70 is already the consensus high for the short-term market.
Q4: Why do experts say that "tariff rhetoric" and "stagflation risk" will affect the bond market at the same time?
A: Tariff rhetoric is often accompanied by expectations of imported inflation, which forces the market to price higher long-term interest rates, thus pushing up long-term US Treasury yields. "Stagflation," on the other hand, refers to the coexistence of slowing economic growth and high inflation. In this environment, central banks face a dilemma: to combat inflation, they need to raise interest rates (benefiting yields and the dollar), but to save the economy, they need to lower interest rates. Current market pricing suggests that central banks seem more inclined to repeat the experience of 2022, namely, reacting to inflationary shocks in advance. This expectation gap has caused bond yields to remain high despite weak economic data, creating what is known as "bond market volatility."
Q5: What are the most important "intraday price movement signals" for ordinary investors to pay attention to in the next 2-3 days?
A: The most crucial signal is the divergence between the 10-year US Treasury yield and oil prices . If oil prices fall, but US Treasury yields remain above 4.20%, it indicates that market concerns have shifted from "energy inflation" to "government bond supply pressure" or "systemic liquidity stress." In this scenario, the US dollar will continue to be strong, while gold may face the risk of testing the $5050 support level due to the loss of its inflation-hedging premium. Conversely, if both fall simultaneously, gold will have a significant opportunity for a rebound.
The underlying logic of bond market liquidity pressure and dollar pricing
In the current macroeconomic environment, the dollar's trajectory is highly anchored to the supply and liquidity structure of the US Treasury market. According to the latest market quotes, the general mortgage (GC) rate opened at a high of 3.69%, reflecting a clear "cash is king" tendency among funds within the system amidst a double sell-off in both the stock and bond markets. This liquidation logic has led to a large inflow of funds back into the money market, providing strong passive support for the dollar index.
From a fundamental perspective, the rise in US Treasury yields is not simply due to optimistic economic growth expectations, but rather to inflationary anxieties and deflationary pressures stemming from geopolitical risks . Renowned economists point out that the global economy is facing the threat of stagflation due to the turbulent situation in Iran and soaring energy costs. Meanwhile, the US Treasury market is about to witness a large-scale auction (including $89 billion in 13-week Treasuries and $77 billion in 26-week Treasuries), and with Bond Vigilantes making a comeback, the market's ability to absorb this record-breaking supply is being tested.
From a technical perspective, the US Dollar Index (DXY) is currently at 99.3898. Although it is in a pullback phase from its highs, it remains above the middle Bollinger Band. Notably, the 240-minute MACD indicator has shown a death cross signal, and the bullish momentum bars have completely converged. This suggests that after encountering selling pressure near 99.70, the dollar may retrace to the 99.00 level in the short term. The key to the dollar's resilience lies in the strength of US Treasury yields—the 10-year Treasury yield encountered strong resistance at the 200-day moving average near 4.21%, but as long as it remains above 4.13%, the dollar's valuation premium will be difficult to erase quickly.
The safe-haven logic of gold under the transmission of the bond market: from inflation hedging to liquidity defense.
Traditionally, rising US Treasury yields would suppress gold prices, but in the current turbulent times, the pricing logic for gold is undergoing a profound shift from being driven by real interest rates to being transmitted through the bond market as a safe haven .
Currently, spot gold is priced at around $5097.12 per ounce. Although it has retreated from its high in early March, the strong support it has shown around $5050 is essentially a safe-haven effect triggered by bond market turmoil. When the 10-year US Treasury yield rose rapidly, due to global investors' concerns about the stability of European and emerging market sovereign debt, funds did not entirely flow into safe-haven currencies, but remained partially in gold, an asset with no default risk .
Energy spillover effects are another key variable in the gold market's logic. With high volatility in crude oil prices, market concerns about double-dip inflation have manifested not only in Europe (such as the surge in UK Gilt bond yields) but also prompted investors to seek gold as a safe-haven asset. Technically, the 240-minute chart for gold shows that its MACD fast and slow lines have flattened below the zero line, and the bearish momentum bars are continuously converging. This suggests that once the US dollar confirms a short-term top and declines, gold will take advantage of the temporary halt in the bond market sell-off to initiate a rebound based on geopolitical safe-haven recovery . Gold's current resistance levels are concentrated in the $5130 (Bollinger Band middle line) and $5200 range, while the bottom support logic is deeply rooted in safe-haven buying in the global credit market.
Trend forecast and key technical levels for the next 2-3 days
Looking ahead to the next 2-3 trading days, the market will enter a "post-pulse recovery period," but the volatility will remain at a high level.
1. 10-year US Treasury yield (refer to the main contract)
Support/resistance range : 4.136% — 4.240%
Range logic : There is dense selling pressure in the range of 4.21% (200-day moving average) to 4.24% above; the key short-term support is 4.136% (Bollinger Band middle line) below.
Key focus during trading : The New York Fed's consumer expectations survey, to be released tonight, warrants attention. If inflation expectations unexpectedly rise, yields could retest the 4.24% high, potentially putting further downward pressure on risk assets.
2. US Dollar Index
Support/resistance range : 99.00 — 99.70
Range logic : The MACD death cross confirms the short-term downward momentum. 99.00, as a psychological level, coincides with the lower Bollinger Band, providing strong support. Multiple attempts to break through and subsequent pullbacks near 99.70 constitute a medium-term technical ceiling.
Key points to watch during trading : Pay attention to the strength of the rebound in non-US currencies (especially the euro and Swiss franc) after the decline in energy prices, as this will directly affect the depth of the DXY correction through cross-currency pairs.
3. Spot Gold
Support/resistance range : $5053 - $5204
Range Logic : The $5050 range has proven to be a resilient support level over the past 10 trading days. If it can hold above $5130 today, it will have the momentum to challenge the upper Bollinger Band ($5204).
Key focus during trading : Will crude oil prices fill the gap between $96.25 and $92.61? If energy prices fall rapidly, gold's inflation-hedging premium may shrink; in that case, it will be necessary to observe whether safe-haven buying in the bond market can offset this negative impact.
Summary and Outlook
The current market dynamics are in a highly sensitive vacuum. On the one hand, long-term inflationary concerns stemming from tariff rhetoric persist; on the other hand, fears of short-term energy supply disruptions have eased somewhat following signals of G7 intervention. In the next 48 hours, investors should closely monitor the performance of US Treasury yields around the 4.21% level. If yields fail to break through further upwards, a temporary peak in the dollar will provide valuable breathing room for gold. However, as economists have warned, the risk of a revaluation in the private credit market remains, and any signs of tightening liquidity could reignite the market's thirst for cash, thus limiting the potential upside for gold.
Frequently Asked Questions
Q1: Why do large fluctuations in crude oil prices directly transmit to the US dollar's trend through the US Treasury market?
A: This transmission mainly occurs through two paths: First, the "inflation expectation" path. As the mother of all commodities, the surge in crude oil prices pushes up break-even inflation, thereby increasing nominal US Treasury yields and enhancing the attractiveness of the US dollar. Second, the "safe-haven liquidity" path. When the energy war escalates, global investors develop pessimistic expectations for non-US economies (especially Europe, which is highly dependent on imports), and funds flow into the US Treasury market for safety reasons. If the bond market experiences a sell-off due to oversupply, the rising yields will further increase the funding costs of the US dollar, reinforcing its strong position.
Q2: How should we understand the "bond market safe-haven effect" mentioned in the article? Why didn't gold fall sharply along with the rise in US Treasury yields?
A: In normal cycles, US Treasury yields and gold are negatively correlated; however, in a crisis scenario, they may rise together. The core logic behind the current strength of gold is "hedging against systemic risk." When the US Treasury market itself fluctuates due to liquidity shortages (such as rising GC rates) or credit risk premiums (such as the turmoil in the UK and French bond markets), investors no longer consider bonds to be absolutely safe. At this time, gold's attribute as the "ultimate safe-haven asset" is activated. As long as the safe-haven premium caused by geopolitical situations exceeds the holding cost brought about by rising real interest rates, gold can maintain a generally strong upward trend.
Q3: How to interpret the current MACD death cross signal of the US dollar index from a technical perspective?
A: A MACD death cross on the 240-minute chart typically indicates a temporary exhaustion in a medium-term uptrend. This means the one-sided upward movement supported by geopolitical fears in the past few weeks may have come to an end, and the market is entering a period of high-level consolidation. Considering the support level of the Bollinger Band middle line at 99.11, this death cross is more of a "time-for-space" oscillation and pullback than a trend reversal. It sends a signal to the market: barring more extreme news, the area around 99.70 is already the consensus high for the short-term market.
Q4: Why do experts say that "tariff rhetoric" and "stagflation risk" will affect the bond market at the same time?
A: Tariff rhetoric is often accompanied by expectations of imported inflation, which forces the market to price higher long-term interest rates, thus pushing up long-term US Treasury yields. "Stagflation," on the other hand, refers to the coexistence of slowing economic growth and high inflation. In this environment, central banks face a dilemma: to combat inflation, they need to raise interest rates (benefiting yields and the dollar), but to save the economy, they need to lower interest rates. Current market pricing suggests that central banks seem more inclined to repeat the experience of 2022, namely, reacting to inflationary shocks in advance. This expectation gap has caused bond yields to remain high despite weak economic data, creating what is known as "bond market volatility."
Q5: What are the most important "intraday price movement signals" for ordinary investors to pay attention to in the next 2-3 days?
A: The most crucial signal is the divergence between the 10-year US Treasury yield and oil prices . If oil prices fall, but US Treasury yields remain above 4.20%, it indicates that market concerns have shifted from "energy inflation" to "government bond supply pressure" or "systemic liquidity stress." In this scenario, the US dollar will continue to be strong, while gold may face the risk of testing the $5050 support level due to the loss of its inflation-hedging premium. Conversely, if both fall simultaneously, gold will have a significant opportunity for a rebound.
- Risk Warning and Disclaimer
- The market involves risk, and trading may not be suitable for all investors. This article is for reference only and does not constitute personal investment advice, nor does it take into account certain users’ specific investment objectives, financial situation, or other needs. Any investment decisions made based on this information are at your own risk.