Non-farm payrolls boosted 90,000 jobs, but gold was hit hard by oil prices: Was the Fed completely dumbfounded?
2026-03-09 21:55:03
On Monday, March 9th, spot gold remained fragile and volatile, caught between the US-Iran conflict and expectations of Federal Reserve policy changes. It briefly fell to $5014 per ounce before rebounding slightly to around $5100 per ounce, but the rebound lacked sustained buying support. Crude oil prices surged above $100 per barrel due to supply risks in the Strait of Hormuz, a single-day increase of over 10%, pushing up global inflation expectations and quickly dampening bets on a Federal Reserve rate cut.
Coupled with the weak data of a surprise 92,000 drop in non-farm payrolls and an unemployment rate rising to 4.4% in February, the market has significantly adjusted its pricing of the Federal Reserve's policy path. As a non-yielding asset, gold is facing the dual pressures of a stronger dollar and rising US Treasury yields, and is unlikely to break out of its range-bound trading pattern in the short term.
The escalating conflict between the US and Iran directly disrupted the global energy supply chain, causing crude oil prices to surge to $119 per barrel, a new high since June 2022. Prices subsequently fell back to around $100 per barrel following news that the G7 countries had discussed and approved the International Energy Agency's coordinated release of reserves, still maintaining a daily increase of over 10%. This energy shock quickly translated into inflation expectations. Although gold is traditionally considered an inflation hedge, cost-push inflation driven by oil prices is often accompanied by rising US Treasury yields and a stronger dollar, thus diminishing its attractiveness.
Traders should note that the surge in energy prices has led to a rapid correction in market expectations for easing by major central banks. The continued high levels of crude oil prices have not only increased global production costs but also amplified the risk of supply chain disruptions. In contrast, while safe-haven buying of gold provided some support in the early stages of the conflict, it could not completely offset the selling pressure resulting from changes in interest rate expectations. The upcoming US Consumer Price Index (CPI) data this week will be a key indicator, with the market expecting the overall CPI to remain at 2.4% year-on-year in February, and the core personal consumption expenditures (PCE) price index to remain stable at 3.0% year-on-year. Any reading higher than expected could further reinforce concerns about inflation.
The February non-farm payrolls report released last Friday showed that the U.S. economy added 92,000 jobs, far below the market expectation of 59,000, and the January figure was also revised down to 126,000. The unemployment rate rose from 4.3% to 4.4%. This weak performance initially triggered market concerns about an economic slowdown, but the inflation risk brought about by soaring oil prices quickly outweighed the employment signal, leaving the Federal Reserve in a dual dilemma of balancing inflation and growth.
The following is a comparison of key recent non-farm payroll data:
MUFG analysts pointed out that the February job contraction was partly due to temporary factors such as severe winter weather and healthcare strikes, but private sector employment only grew by an average of 30,000 jobs per month, far below the historical average, indicating that the underlying trend remains weak. Coupled with the impact of energy price shocks, the Federal Reserve must be wary of both rising inflation and a cooling labor market, significantly limiting its policy space.
TD Securities analysts believe that tensions related to Iran are causing the US dollar to regain its safe-haven appeal. This directly pushes up the dollar index and US Treasury yields, thus putting continued downward pressure on gold. The 10-year US Treasury yield has recently rebounded to around 4.2%, reflecting market expectations that the Federal Reserve will maintain high interest rates for a longer period. Traders have observed that the correlation between gold and the dollar has strengthened again in the current environment, and any escalation of geopolitical events or better-than-expected inflation data could amplify this linkage effect.
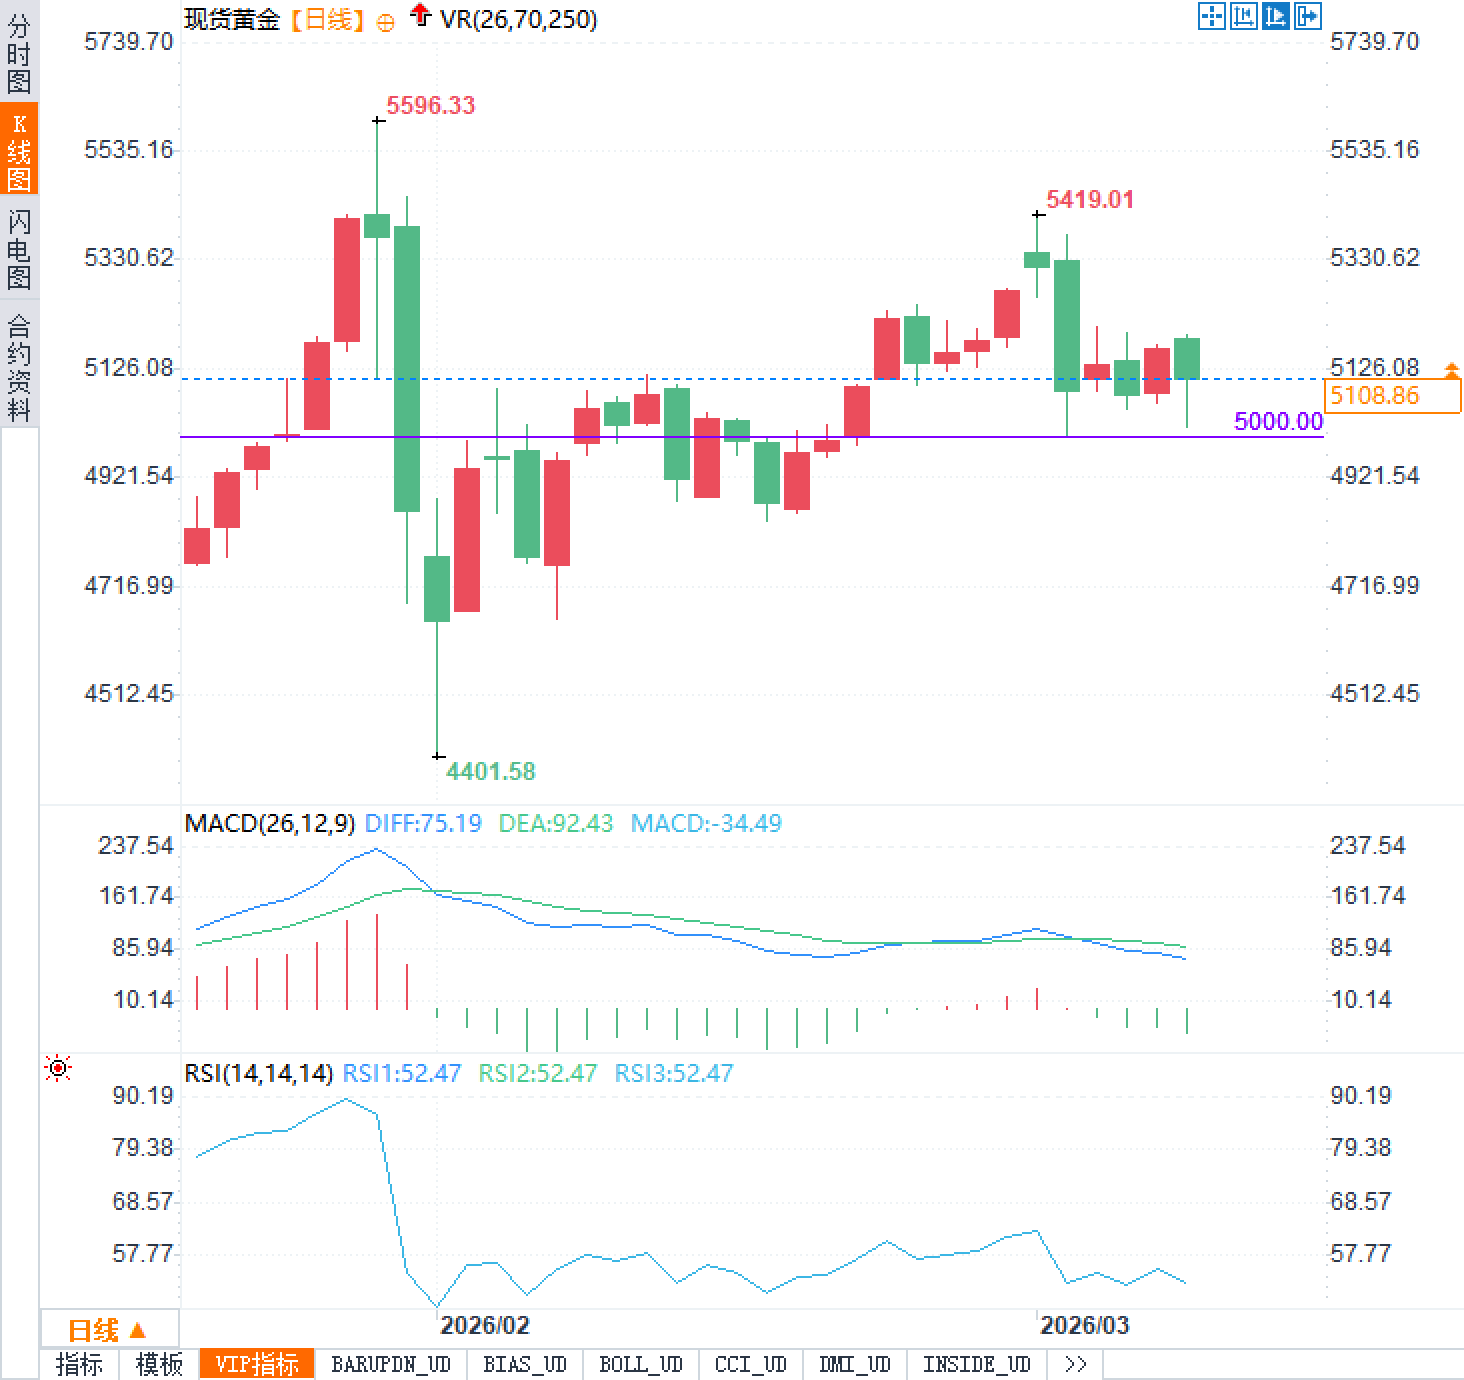
From the daily chart, spot gold has been fluctuating between $5,000 and $5,200 recently, and is currently near $5,100 per ounce. The MACD indicator shows that the DIFF is 75.19, the DEA is 92.43, and the MACD histogram is -34.49, indicating that short-term downward momentum still exists. The RSI (14) reading is 52.47, which is in the neutral range, neither overbought nor oversold.
Traders are focused on the potential impact of this week's inflation data on a potential breakout from the current range. If oil prices remain high and expectations for a Fed rate cut continue to decline, the likelihood of gold testing the $5,000 level will increase. Conversely, if geopolitical risks escalate further, safe-haven buying could push prices back above $5,200.
Coupled with the weak data of a surprise 92,000 drop in non-farm payrolls and an unemployment rate rising to 4.4% in February, the market has significantly adjusted its pricing of the Federal Reserve's policy path. As a non-yielding asset, gold is facing the dual pressures of a stronger dollar and rising US Treasury yields, and is unlikely to break out of its range-bound trading pattern in the short term.
The surge in oil prices has reignited inflation concerns, partially offsetting gold's safe-haven appeal.
The escalating conflict between the US and Iran directly disrupted the global energy supply chain, causing crude oil prices to surge to $119 per barrel, a new high since June 2022. Prices subsequently fell back to around $100 per barrel following news that the G7 countries had discussed and approved the International Energy Agency's coordinated release of reserves, still maintaining a daily increase of over 10%. This energy shock quickly translated into inflation expectations. Although gold is traditionally considered an inflation hedge, cost-push inflation driven by oil prices is often accompanied by rising US Treasury yields and a stronger dollar, thus diminishing its attractiveness.
Traders should note that the surge in energy prices has led to a rapid correction in market expectations for easing by major central banks. The continued high levels of crude oil prices have not only increased global production costs but also amplified the risk of supply chain disruptions. In contrast, while safe-haven buying of gold provided some support in the early stages of the conflict, it could not completely offset the selling pressure resulting from changes in interest rate expectations. The upcoming US Consumer Price Index (CPI) data this week will be a key indicator, with the market expecting the overall CPI to remain at 2.4% year-on-year in February, and the core personal consumption expenditures (PCE) price index to remain stable at 3.0% year-on-year. Any reading higher than expected could further reinforce concerns about inflation.
The unexpected decline in non-farm payroll data highlights the Federal Reserve's policy dilemma.
The February non-farm payrolls report released last Friday showed that the U.S. economy added 92,000 jobs, far below the market expectation of 59,000, and the January figure was also revised down to 126,000. The unemployment rate rose from 4.3% to 4.4%. This weak performance initially triggered market concerns about an economic slowdown, but the inflation risk brought about by soaring oil prices quickly outweighed the employment signal, leaving the Federal Reserve in a dual dilemma of balancing inflation and growth.
The following is a comparison of key recent non-farm payroll data:
| month | New jobs created (in thousands) | unemployment rate(%) |
|---|---|---|
| February 2026 | -92 | 4.4 |
| January 2026 | 126 | 4.3 |
| December 2025 | Approximately 150 | 4.2 |
The US dollar's safe-haven appeal has re-emerged.
TD Securities analysts believe that tensions related to Iran are causing the US dollar to regain its safe-haven appeal. This directly pushes up the dollar index and US Treasury yields, thus putting continued downward pressure on gold. The 10-year US Treasury yield has recently rebounded to around 4.2%, reflecting market expectations that the Federal Reserve will maintain high interest rates for a longer period. Traders have observed that the correlation between gold and the dollar has strengthened again in the current environment, and any escalation of geopolitical events or better-than-expected inflation data could amplify this linkage effect.
Technically, the price is expected to remain range-bound between 5000 and 5200, with the MACD indicating slight downward momentum.
From the daily chart, spot gold has been fluctuating between $5,000 and $5,200 recently, and is currently near $5,100 per ounce. The MACD indicator shows that the DIFF is 75.19, the DEA is 92.43, and the MACD histogram is -34.49, indicating that short-term downward momentum still exists. The RSI (14) reading is 52.47, which is in the neutral range, neither overbought nor oversold.
Traders are focused on the potential impact of this week's inflation data on a potential breakout from the current range. If oil prices remain high and expectations for a Fed rate cut continue to decline, the likelihood of gold testing the $5,000 level will increase. Conversely, if geopolitical risks escalate further, safe-haven buying could push prices back above $5,200.
Frequently Asked Questions
Question 1: How can the tensions between the US and Iran simultaneously support and suppress gold prices?
A: In the early stages of the conflict, the surge in safe-haven demand provided support for gold, but the disruption of oil supply led to a surge in oil prices, which in turn triggered rising inflation expectations, higher US Treasury yields, and a stronger dollar. These factors together weakened the attractiveness of non-yielding assets, creating a dual game.
Question 2: Why did the weak non-farm payroll data fail to prompt the Federal Reserve to accelerate interest rate cuts?
A: Although the 92,000 fewer jobs added in February and the unemployment rate rising to 4.4% indicate a slowdown in the labor market, the inflation risk, driven by oil price shocks, has led the Federal Reserve to prioritize price control. The market has already lowered the probability of a 25 basis point rate cut in June to about 30%-40%, highlighting the policy dilemma.
Question 3: What is the technical significance of the current range-bound movement of gold?
A: Prices are fluctuating within the $5000-$5200 range. The slightly negative MACD indicates downward momentum, while the neutral RSI at 52.47 suggests a balance between bulls and bears. This week's US inflation data will be a catalyst for a breakout, and traders should be wary of the risk of accelerated trend after a breakout from the range.
- Risk Warning and Disclaimer
- The market involves risk, and trading may not be suitable for all investors. This article is for reference only and does not constitute personal investment advice, nor does it take into account certain users’ specific investment objectives, financial situation, or other needs. Any investment decisions made based on this information are at your own risk.