Trump threatens to deliver a heavy blow to Iran next week; could the gold price trap be coming to an end?
2026-03-13 20:07:32
On Friday, March 13, US President Trump stated that he would launch a strong attack on Iran next week and mentioned taking escort action in the Strait of Hormuz if necessary. This statement directly continued the escalation path of the US-Iran conflict since the end of February, causing the crude oil and precious metals markets to maintain a defensive posture, especially as the weekend approached.
Brent crude oil prices stabilized around $100 per barrel, after recording their biggest single-day gain in six years due to the escalating US-Iran conflict; spot gold, after rebounding from a low of $5054, is currently consolidating in a narrow range around $5100. On the fundamental front, supply uncertainty in the Middle East is pushing up energy risk premiums, leading to rising inflation expectations. Gold, as a traditional safe-haven asset, is constrained by both a stronger dollar and rising yields, exhibiting pulse-like volatility.
The core of Trump's interview was the explicit timeline for escalation and the possibility of escorting ships, contrasting sharply with the market's previous expectation that the conflict was "controllable." The Strait of Hormuz, a vital artery for approximately 20% of global oil transport, poses a significant risk of disruption, directly amplifying the crude oil supply gap. Historical data shows that similar geopolitical events often push up oil price risk premiums by 10% to 15% in the first week, subsequently impacting global inflation. The current conflict has entered a critical window; if Iran retaliates in conjunction with regional forces, energy price volatility will further amplify. The gold market's reaction has been complex: initial buying was driven by safe-haven demand, but the strengthening of the US dollar index due to pressure on risk assets offset some of the support. Overall, the market has entered a "short-term risk or neutral" defensive range, with fund flows indicating that institutions are more inclined to lock in existing positions rather than aggressively adding to them.
The correlation between crude oil and gold is not a simple positive correlation, but rather occurs through multiple layers of transmission. Brent crude oil has risen by over 45% monthly since the escalation of the conflict, directly increasing global energy costs and consequently pushing up inflation expectations. This has forced the Federal Reserve to shift its focus from the labor market to price stability, significantly delaying expectations of interest rate cuts, and causing rising US Treasury yields to suppress the cost of holding gold. However, the persistence of geopolitical risk premiums provides a floor for gold. Analysis indicates that the impact of geopolitical conflicts on precious metals exhibits a "pulse-like" characteristic, meaning that safe-haven trading is concentrated in the early stages of the conflict, and subsequent movements depend on the actual scope of its spread.
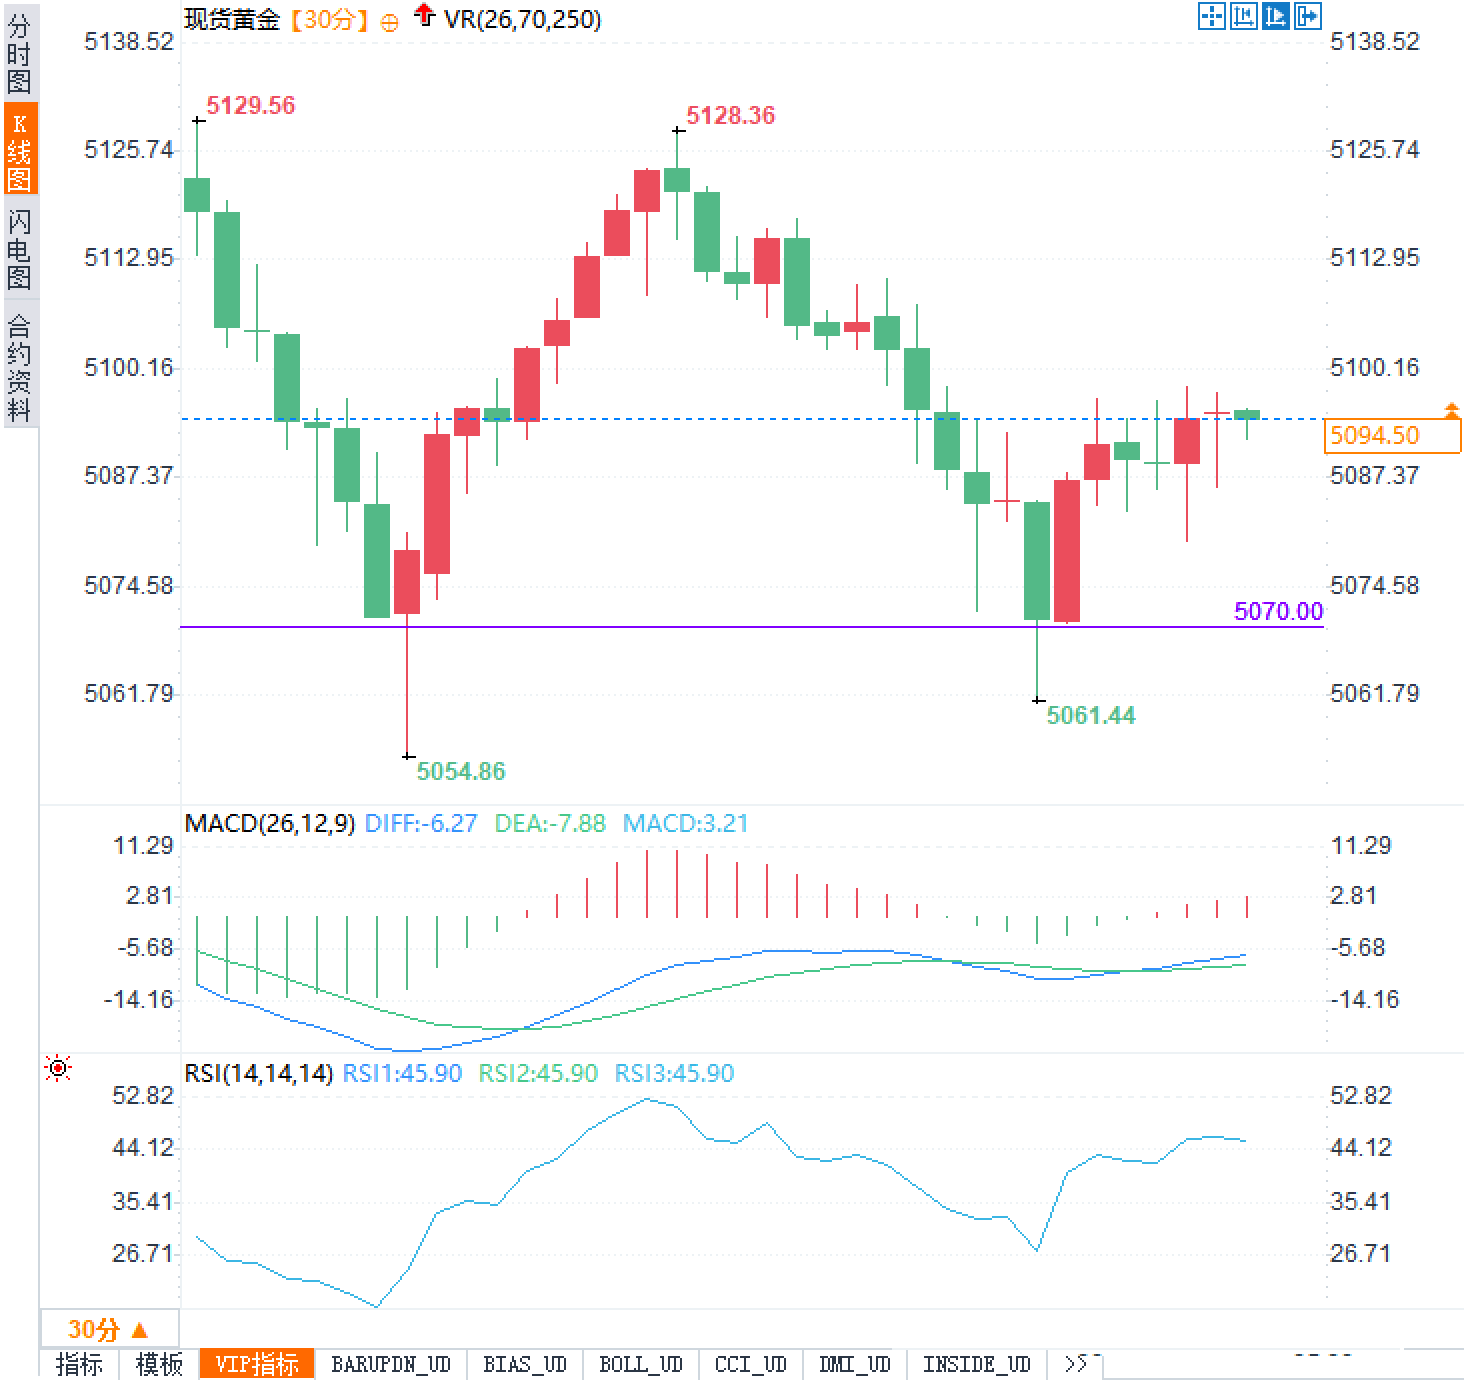
Observing the 30-minute candlestick chart, spot gold has recently been oscillating between a low of $5054.86 and a high of $5129.56, exhibiting a range-bound consolidation pattern. The MACD indicator shows the DIFF line at -6.27, the DEA line at -7.88, and the MACD histogram at 3.21, suggesting that short-term momentum is tending towards equilibrium. Overall, the technical picture conforms to the characteristics of high volatility and low trend driven by geopolitics, with capital flows concentrated at the upper and lower edges of the trading range.
The current macroeconomic backdrop is compounded by multiple variables: inflationary pressures from high oil prices may prolong the high-interest-rate environment, weakening the attractiveness of holding gold; meanwhile, uncertainty surrounding regional conflicts preserves a premium for safe-haven assets. The market generally assesses that, in the short term, without further military escalation or diplomatic breakthroughs, gold prices will maintain a narrow trading range; in the medium to long term, it will depend on the speed of energy supply recovery and the degree of global risk appetite recovery. Traders need to closely monitor developments in the Strait of Hormuz and the latest statements from Federal Reserve officials to assess marginal changes in risk premiums. Overall, a defensive stance remains the dominant logic, and any unexpected event could disrupt the current balance.
Brent crude oil prices stabilized around $100 per barrel, after recording their biggest single-day gain in six years due to the escalating US-Iran conflict; spot gold, after rebounding from a low of $5054, is currently consolidating in a narrow range around $5100. On the fundamental front, supply uncertainty in the Middle East is pushing up energy risk premiums, leading to rising inflation expectations. Gold, as a traditional safe-haven asset, is constrained by both a stronger dollar and rising yields, exhibiting pulse-like volatility.
Trump's remarks exacerbated geopolitical risk premiums, activating a full-blown defensive mode in the market.
The core of Trump's interview was the explicit timeline for escalation and the possibility of escorting ships, contrasting sharply with the market's previous expectation that the conflict was "controllable." The Strait of Hormuz, a vital artery for approximately 20% of global oil transport, poses a significant risk of disruption, directly amplifying the crude oil supply gap. Historical data shows that similar geopolitical events often push up oil price risk premiums by 10% to 15% in the first week, subsequently impacting global inflation. The current conflict has entered a critical window; if Iran retaliates in conjunction with regional forces, energy price volatility will further amplify. The gold market's reaction has been complex: initial buying was driven by safe-haven demand, but the strengthening of the US dollar index due to pressure on risk assets offset some of the support. Overall, the market has entered a "short-term risk or neutral" defensive range, with fund flows indicating that institutions are more inclined to lock in existing positions rather than aggressively adding to them.
The linkage mechanism between crude oil and gold: the interaction of risk premium, inflation expectations and monetary policy.
The correlation between crude oil and gold is not a simple positive correlation, but rather occurs through multiple layers of transmission. Brent crude oil has risen by over 45% monthly since the escalation of the conflict, directly increasing global energy costs and consequently pushing up inflation expectations. This has forced the Federal Reserve to shift its focus from the labor market to price stability, significantly delaying expectations of interest rate cuts, and causing rising US Treasury yields to suppress the cost of holding gold. However, the persistence of geopolitical risk premiums provides a floor for gold. Analysis indicates that the impact of geopolitical conflicts on precious metals exhibits a "pulse-like" characteristic, meaning that safe-haven trading is concentrated in the early stages of the conflict, and subsequent movements depend on the actual scope of its spread.
30-minute technical characteristics of spot gold: trading range and neutral indicator signals
Observing the 30-minute candlestick chart, spot gold has recently been oscillating between a low of $5054.86 and a high of $5129.56, exhibiting a range-bound consolidation pattern. The MACD indicator shows the DIFF line at -6.27, the DEA line at -7.88, and the MACD histogram at 3.21, suggesting that short-term momentum is tending towards equilibrium. Overall, the technical picture conforms to the characteristics of high volatility and low trend driven by geopolitics, with capital flows concentrated at the upper and lower edges of the trading range.
Macroeconomic Environment and Potential Risk Outlook
The current macroeconomic backdrop is compounded by multiple variables: inflationary pressures from high oil prices may prolong the high-interest-rate environment, weakening the attractiveness of holding gold; meanwhile, uncertainty surrounding regional conflicts preserves a premium for safe-haven assets. The market generally assesses that, in the short term, without further military escalation or diplomatic breakthroughs, gold prices will maintain a narrow trading range; in the medium to long term, it will depend on the speed of energy supply recovery and the degree of global risk appetite recovery. Traders need to closely monitor developments in the Strait of Hormuz and the latest statements from Federal Reserve officials to assess marginal changes in risk premiums. Overall, a defensive stance remains the dominant logic, and any unexpected event could disrupt the current balance.
Frequently Asked Questions
Question 1: What will be the core impact on the gold and crude oil markets if Trump makes tough statements about striking Iran next week?
A: The core issue is amplifying the risk of supply disruptions in the Strait of Hormuz, which has led to a short-term increase of over 10% in the risk premium for oil prices, directly pushing up inflation expectations. Gold, on the other hand, is supported by safe-haven demand, but the strengthening of the US dollar and rising yields offset each other, resulting in a pulse-like rather than sustained price increase, and the market as a whole has turned defensive.
Question 2: Why has the current 30-minute chart for spot gold formed a trading range, and what signals are the technical indicators conveying?
A: The 5050 to 5130 range is the result of the battle between bulls and bears after the geopolitical event. The narrowing of the MACD histogram and the neutral RSI reading of 45.90 indicate that the momentum is balanced and there is no clear direction. This reflects that traders are waiting for the conflict to become clearer, and the upper and lower edges of the range have become key test points in the short term.
Question 3: If the conflict in the Middle East continues to escalate, how will the correlation between gold and crude oil evolve?
A: The dual drivers of oil price and inflation will strengthen gold's anti-inflationary properties and push prices up; however, if the conflict subsides quickly, the safe-haven premium fades, and the Fed's policy path becomes clear, gold prices will likely give back their gains, exhibiting the historical pattern of "rising expectations, selling reality".
- Risk Warning and Disclaimer
- The market involves risk, and trading may not be suitable for all investors. This article is for reference only and does not constitute personal investment advice, nor does it take into account certain users’ specific investment objectives, financial situation, or other needs. Any investment decisions made based on this information are at your own risk.