With the ultimatum delayed by 10 days, what will become of the crude oil risk premium?
2026-03-27 18:57:51
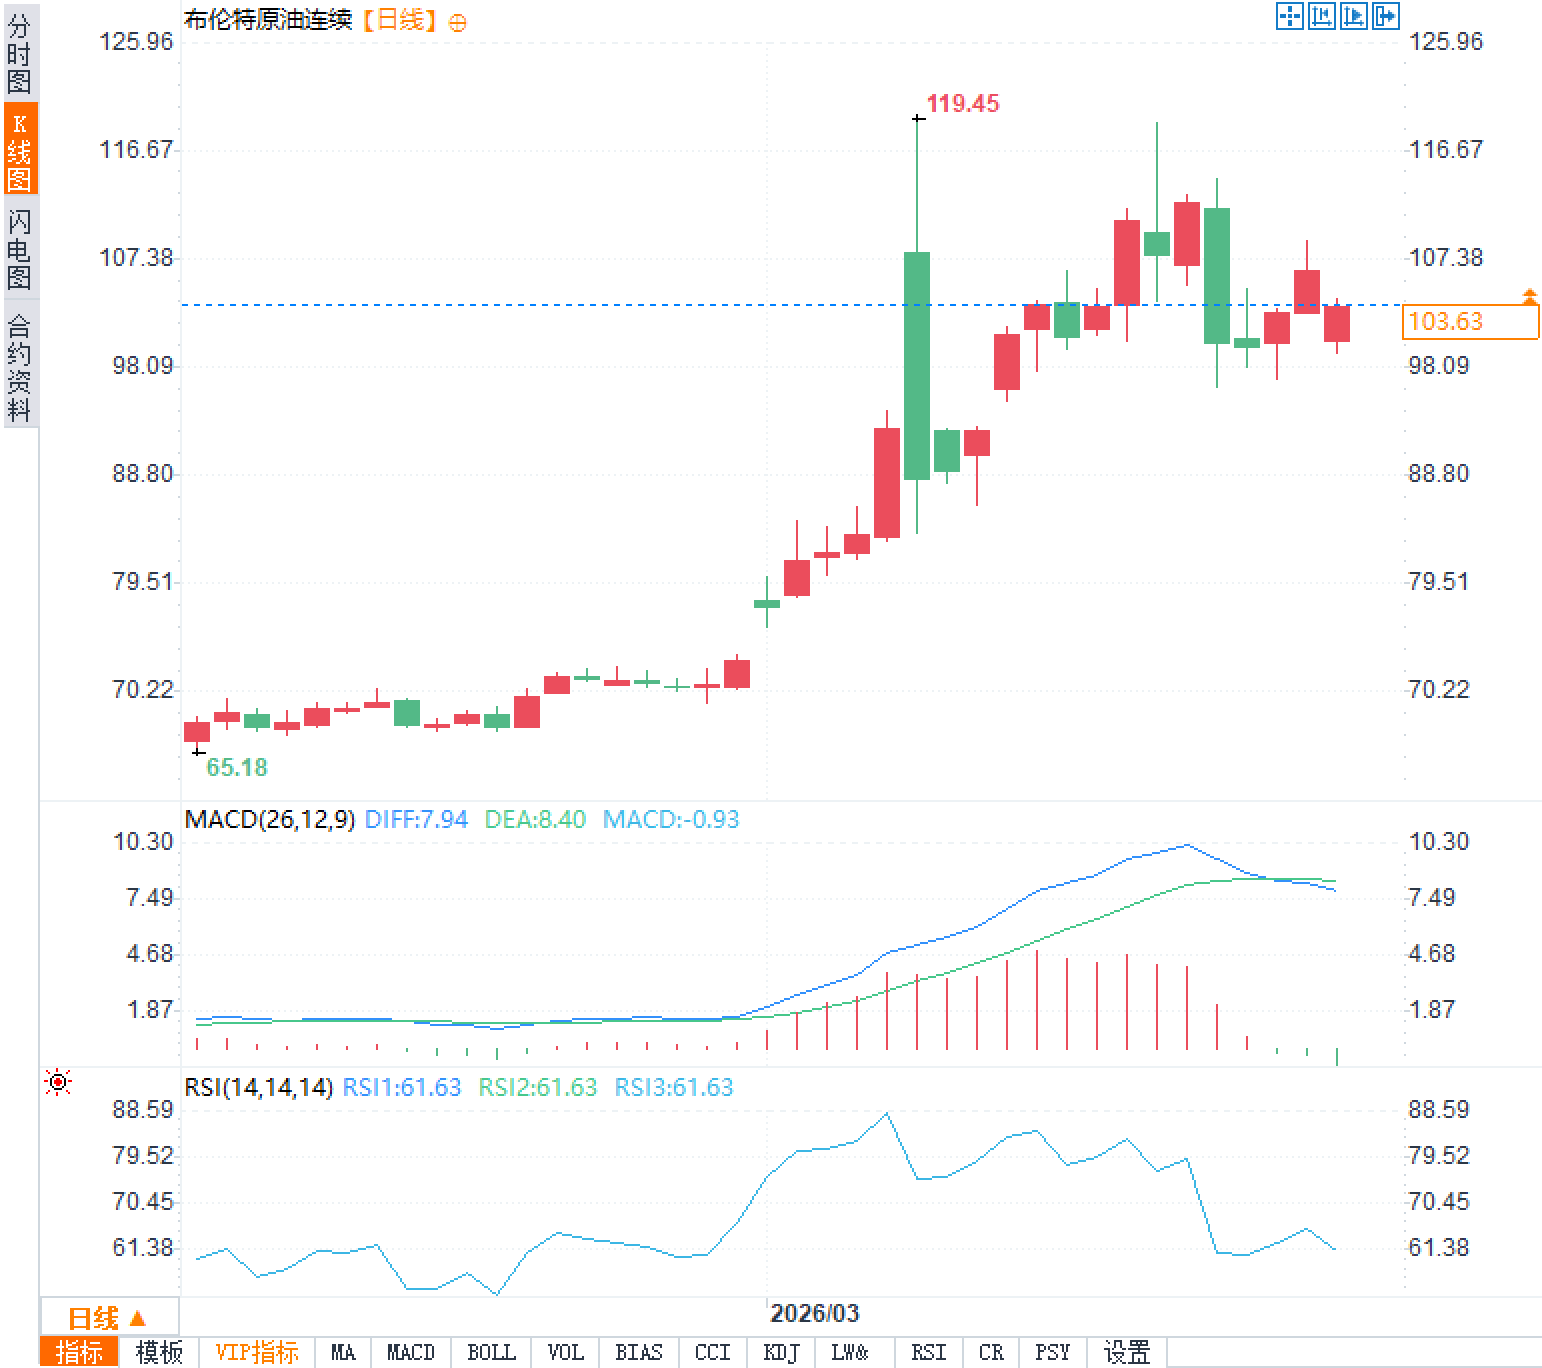
On Friday, March 27, international crude oil prices stabilized after Trump again postponed the deadline for the energy deal with Iran. Trump stated that Iran had requested a seven-day extension, but he opted for a ten-day grace period, setting the new deadline at April 6. This adjustment temporarily eased market concerns about immediate supply disruptions, but risks driven primarily by geopolitical factors remain skewed to the upside. Brent crude traded around $103.5 per barrel, while WTI crude was near $96.5 per barrel. Traders are assessing the vulnerability of flows in the Gulf region and the ripple effects on the global energy chain, while also monitoring additional liquefied natural gas supply shocks and inventory divergence signals in major consumption centers.
While the extended agreement removed some immediate pressure, supply-side vulnerabilities remained unresolved. Currently, approximately 8 million barrels per day of production is offline, and a larger volume of shipping traffic in the Gulf remains highly exposed to risk, making a substantial decline in the geopolitical premium unlikely. Trump stated on Thursday that he was unsure whether the US was willing to cooperate with Iran to reach an agreement. Iran responded through intermediaries to the US-backed 15-point peace proposal, but had previously rejected similar contacts multiple times and continued to impose its own conditions, including passing legislation to impose transit fees on the Strait of Hormuz in exchange for security guarantees for ships. Despite the continued military presence of both sides and the increased US deployment in the region, concerns about supply disruptions remain high.
The latest warning from Iran's Islamic Revolutionary Guard Corps reiterates that the status quo in the Strait of Hormuz remains unchanged, effectively closed, and prohibits the passage of any vessels involving the United States and its allies, with violators facing severe measures. Local Iranian media reported that three container ships of different nationalities were refused passage after the warning. Although Iran allowed 10 oil tankers to pass as a gesture of goodwill and released stranded Malaysian vessels, actual daily traffic volume has shrunk significantly compared to pre-conflict levels, and overall navigation remains highly restricted. US Treasury Secretary Scott Bessant stated that an insurance program aimed at improving shipping through the Strait is about to be launched, and Malaysian Prime Minister Anwar Ibrahim confirmed that the relevant vessels have been allowed to return. While these measures release some signs of easing tensions, their actual impact is limited compared to the daily traffic volume. The struggle for control of the Strait directly relates to the security of approximately 20% of the global crude oil transportation route; if restrictions continue or expand, the costs of supply chain disruptions will quickly be transmitted to the spot market and forward curve structure.
The supply risks in the liquefied natural gas (LNG) market have significantly intensified. A tropical cyclone forced three Australian LNG plants to reduce production, these plants collectively accounting for about 8% of global supply. This, coupled with the closure of the Strait of Hormuz and the shutdown of Qatar's largest LNG facility due to an attack, further tightened the already strained supply situation, putting significant price pressure on Asian buyers. US natural gas prices continued their upward trend, with the previous month's Henry Hub futures contract approaching $3/MMBtu. Data from the US Energy Information Administration showed that last week's inventory withdrawals reached 5.4 billion cubic feet, far exceeding the five-year average of 2.1 billion cubic feet, bringing inventories down to 1.829 trillion cubic feet, only 0.8% higher than the seasonal average. This larger-than-expected inventory reduction reinforced market expectations of a tight balance, with medium-term crack spreads and seasonal demand factors continuing to provide support.
European ARA refined product inventories fell by 115,000 tonnes to 5.3 million tonnes this week, mainly driven by a decrease of 75,000 tonnes in gasoline, 45,000 tonnes in naphtha, and 13,000 tonnes in fuel oil, while gas oil inventories increased by 57,000 tonnes to 2.15 million tonnes. Despite the divergence in total inventory, middle distillate crack spreads remained firm, with ICE gas oil crack spreads holding above $50/barrel in early trading this week. Singapore refined product inventories surged by 2.2 million barrels to 52 million barrels this week, the highest level since December 2024, with middle distillates increasing by 1.23 million barrels, light distillates by 500,000 barrels, and residual fuel oil by 471,000 barrels to 24.5 million barrels. This inventory divergence reflects regional demand differences and logistical bottlenecks, supporting the midstream product spread structure.
Traders use the aforementioned inventory data to assess the resilience of downstream cracking spreads. Given the ongoing geopolitical uncertainty, these supporting factors will become a key buffer against price fluctuations.
The short-term impact of geopolitical delays on crude oil prices
While the extended agreement removed some immediate pressure, supply-side vulnerabilities remained unresolved. Currently, approximately 8 million barrels per day of production is offline, and a larger volume of shipping traffic in the Gulf remains highly exposed to risk, making a substantial decline in the geopolitical premium unlikely. Trump stated on Thursday that he was unsure whether the US was willing to cooperate with Iran to reach an agreement. Iran responded through intermediaries to the US-backed 15-point peace proposal, but had previously rejected similar contacts multiple times and continued to impose its own conditions, including passing legislation to impose transit fees on the Strait of Hormuz in exchange for security guarantees for ships. Despite the continued military presence of both sides and the increased US deployment in the region, concerns about supply disruptions remain high.
Current status of navigation in the Strait of Hormuz and the risk of supply disruption
The latest warning from Iran's Islamic Revolutionary Guard Corps reiterates that the status quo in the Strait of Hormuz remains unchanged, effectively closed, and prohibits the passage of any vessels involving the United States and its allies, with violators facing severe measures. Local Iranian media reported that three container ships of different nationalities were refused passage after the warning. Although Iran allowed 10 oil tankers to pass as a gesture of goodwill and released stranded Malaysian vessels, actual daily traffic volume has shrunk significantly compared to pre-conflict levels, and overall navigation remains highly restricted. US Treasury Secretary Scott Bessant stated that an insurance program aimed at improving shipping through the Strait is about to be launched, and Malaysian Prime Minister Anwar Ibrahim confirmed that the relevant vessels have been allowed to return. While these measures release some signs of easing tensions, their actual impact is limited compared to the daily traffic volume. The struggle for control of the Strait directly relates to the security of approximately 20% of the global crude oil transportation route; if restrictions continue or expand, the costs of supply chain disruptions will quickly be transmitted to the spot market and forward curve structure.
Tight LNG Supply and Natural Gas Market Dynamics
The supply risks in the liquefied natural gas (LNG) market have significantly intensified. A tropical cyclone forced three Australian LNG plants to reduce production, these plants collectively accounting for about 8% of global supply. This, coupled with the closure of the Strait of Hormuz and the shutdown of Qatar's largest LNG facility due to an attack, further tightened the already strained supply situation, putting significant price pressure on Asian buyers. US natural gas prices continued their upward trend, with the previous month's Henry Hub futures contract approaching $3/MMBtu. Data from the US Energy Information Administration showed that last week's inventory withdrawals reached 5.4 billion cubic feet, far exceeding the five-year average of 2.1 billion cubic feet, bringing inventories down to 1.829 trillion cubic feet, only 0.8% higher than the seasonal average. This larger-than-expected inventory reduction reinforced market expectations of a tight balance, with medium-term crack spreads and seasonal demand factors continuing to provide support.
Global refined product inventory changes and crack spread observation
European ARA refined product inventories fell by 115,000 tonnes to 5.3 million tonnes this week, mainly driven by a decrease of 75,000 tonnes in gasoline, 45,000 tonnes in naphtha, and 13,000 tonnes in fuel oil, while gas oil inventories increased by 57,000 tonnes to 2.15 million tonnes. Despite the divergence in total inventory, middle distillate crack spreads remained firm, with ICE gas oil crack spreads holding above $50/barrel in early trading this week. Singapore refined product inventories surged by 2.2 million barrels to 52 million barrels this week, the highest level since December 2024, with middle distillates increasing by 1.23 million barrels, light distillates by 500,000 barrels, and residual fuel oil by 471,000 barrels to 24.5 million barrels. This inventory divergence reflects regional demand differences and logistical bottlenecks, supporting the midstream product spread structure.
| area | Weekly Changes | Current inventory | Key driving factors |
|---|---|---|---|
| European ARA | Reduced by 115,000 tons | 5.3 million tons | Gasoline, naphtha, and fuel oil prices declined. |
| Singapore | Increase by 2.2 million barrels | 52 million barrels | Accumulation of middle distillate and light distillate oil |
- Risk Warning and Disclaimer
- The market involves risk, and trading may not be suitable for all investors. This article is for reference only and does not constitute personal investment advice, nor does it take into account certain users’ specific investment objectives, financial situation, or other needs. Any investment decisions made based on this information are at your own risk.