The dollar strengthened ahead of the US CPI release, while gold prices fell due to multiple pressures.
2026-05-12 15:18:31
Gold prices retreated from a three-week high during Asian trading hours on Tuesday (May 12), gradually declining and briefly falling below the $4,700 mark. As of 15:15, spot gold touched a low of $4,687.34 per ounce and is currently trading around $4,696. The market remains cautious, awaiting guidance from the US CPI. Coupled with continued geopolitical tensions in the Middle East, with US-Iran peace talks teetering on the brink of collapse, the safe-haven appeal of the US dollar has increased, supporting high oil prices and reinforcing global inflation concerns and hawkish expectations from the Federal Reserve. The slight strengthening of the dollar further limits the upside potential of gold, resulting in short-term downward pressure and volatility in gold prices.
Recent negative news regarding the Middle East situation has continued to escalate, with the ongoing stalemate between the US and Iran significantly dampening expectations for a peace agreement. US President Trump formally rejected Iran's ceasefire proposal, and the two sides remain irreconcilable on core issues such as negotiations on Iran's nuclear program and shipping control in the Strait of Hormuz. The standoff, which has lasted for over two months, shows no signs of easing.
Related reports indicate that Trump has lost patience with the long-standing blockade of the Strait of Hormuz and is quite dissatisfied with Iran's attitude in the ceasefire negotiations. Several Trump aides revealed that, compared to the cautious stance of recent weeks, the US is now more seriously considering resuming large-scale military operations. The rapidly escalating expectations of geopolitical conflict are causing safe-haven funds to flow back into dollar assets, indirectly putting downward pressure on gold prices.
Markets are widely concerned that the Middle East standoff, pushing up energy prices, could reignite global inflationary pressures. Market pricing indicates a roughly 25% probability of the Federal Reserve restarting interest rate hikes before the end of the year, an expectation that further strengthens the dollar's position. Currently, all eyes are on the US CPI data, which will directly influence market expectations regarding the Fed's future monetary policy, thereby affecting the strength of the dollar and gold pricing.
Driven by rising expectations of a hawkish stance from the Federal Reserve, the US dollar index rose slightly, putting significant pressure on gold as a non-interest-bearing precious metal asset, with prices retreating from the high range of $4773 to $4774. However, judging from the market performance, the decline in gold prices was not accompanied by a sustained sell-off, indicating insufficient downward momentum. Investors should not be overly bearish on the future of gold prices.
From a technical perspective, gold's four-hour chart shows strong resilience, finding support and stabilizing below the 100-period simple moving average on Monday. Gold prices rebounded from the 38.2% Fibonacci retracement level of the decline in April and May, subsequently breaking through the 61.8% retracement level. The overall technical pattern provides favorable support for the bullish trend.
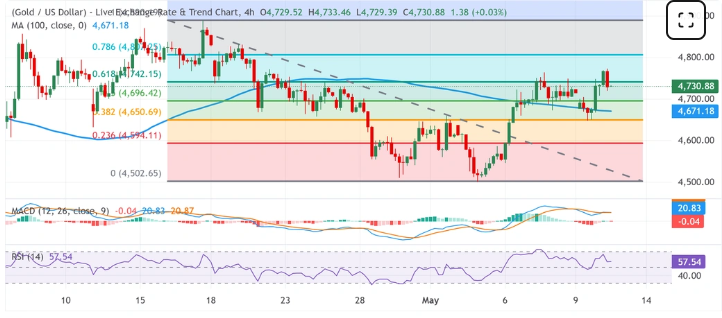
(Spot gold 4-hour chart)
Momentum indicators show that the upward momentum of gold prices is generally solid, but has not yet entered a strong one-sided upward trend. The Relative Strength Index (RSI) remains around 58, showing mild bullish momentum; the MACD histogram is running slightly below the zero line, indicating that the bulls and bears are temporarily in equilibrium.
Key resistance levels are concentrated around the 61.8% Fibonacci retracement level at $4742, followed by the 78.6% retracement level near $4807, and the previous high of $4890. Currently, the price is testing the 50% retracement level at $4696, then the 100-period moving average near $4671, and further down, the 38.2% retracement level at $4651 provides significant support. If the price weakens further, the structural support area at $4594 and $4503 will become crucial support levels.
Overall, gold prices have been dragged down in the short term by multiple factors, including geopolitical tensions in the Middle East, a stronger dollar, and expectations of a Federal Reserve rate hike, fluctuating downwards from a three-week high and approaching the $4,700 mark. The geopolitical situation could escalate further at any time, and with US inflation data due soon, volatility may intensify. Technically, the bullish structure has not been completely broken, and selling pressure lacks sustainability. Gold prices are currently in a tug-of-war between bulls and bears, and future price movements will depend heavily on inflation data and developments in the Middle East.
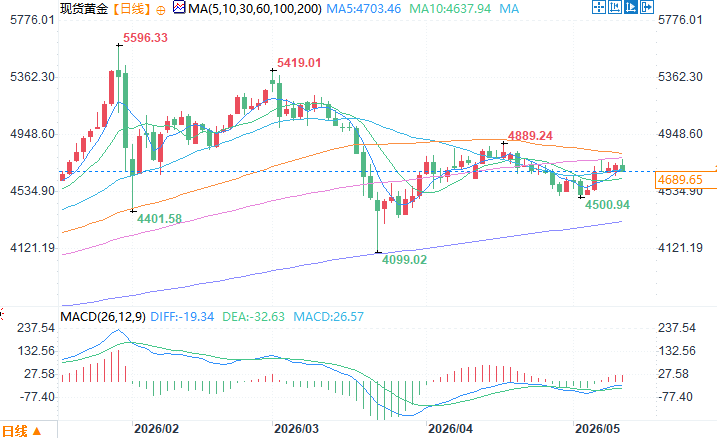
Spot gold daily chart source: EasyForex
At 15:17 Beijing time on May 12, spot gold was trading at $4696.65 per ounce.
Escalating geopolitical crises dragged gold prices down after an initial surge.
Recent negative news regarding the Middle East situation has continued to escalate, with the ongoing stalemate between the US and Iran significantly dampening expectations for a peace agreement. US President Trump formally rejected Iran's ceasefire proposal, and the two sides remain irreconcilable on core issues such as negotiations on Iran's nuclear program and shipping control in the Strait of Hormuz. The standoff, which has lasted for over two months, shows no signs of easing.
Related reports indicate that Trump has lost patience with the long-standing blockade of the Strait of Hormuz and is quite dissatisfied with Iran's attitude in the ceasefire negotiations. Several Trump aides revealed that, compared to the cautious stance of recent weeks, the US is now more seriously considering resuming large-scale military operations. The rapidly escalating expectations of geopolitical conflict are causing safe-haven funds to flow back into dollar assets, indirectly putting downward pressure on gold prices.
Inflation and Federal Reserve expectations have strengthened the dollar, putting downward pressure on gold prices.
Markets are widely concerned that the Middle East standoff, pushing up energy prices, could reignite global inflationary pressures. Market pricing indicates a roughly 25% probability of the Federal Reserve restarting interest rate hikes before the end of the year, an expectation that further strengthens the dollar's position. Currently, all eyes are on the US CPI data, which will directly influence market expectations regarding the Fed's future monetary policy, thereby affecting the strength of the dollar and gold pricing.
Driven by rising expectations of a hawkish stance from the Federal Reserve, the US dollar index rose slightly, putting significant pressure on gold as a non-interest-bearing precious metal asset, with prices retreating from the high range of $4773 to $4774. However, judging from the market performance, the decline in gold prices was not accompanied by a sustained sell-off, indicating insufficient downward momentum. Investors should not be overly bearish on the future of gold prices.
Technical analysis suggests that gold has entered a tug-of-war between bulls and bears.
From a technical perspective, gold's four-hour chart shows strong resilience, finding support and stabilizing below the 100-period simple moving average on Monday. Gold prices rebounded from the 38.2% Fibonacci retracement level of the decline in April and May, subsequently breaking through the 61.8% retracement level. The overall technical pattern provides favorable support for the bullish trend.
(Spot gold 4-hour chart)
Momentum indicators show that the upward momentum of gold prices is generally solid, but has not yet entered a strong one-sided upward trend. The Relative Strength Index (RSI) remains around 58, showing mild bullish momentum; the MACD histogram is running slightly below the zero line, indicating that the bulls and bears are temporarily in equilibrium.
Key resistance levels are concentrated around the 61.8% Fibonacci retracement level at $4742, followed by the 78.6% retracement level near $4807, and the previous high of $4890. Currently, the price is testing the 50% retracement level at $4696, then the 100-period moving average near $4671, and further down, the 38.2% retracement level at $4651 provides significant support. If the price weakens further, the structural support area at $4594 and $4503 will become crucial support levels.
Summarize
Overall, gold prices have been dragged down in the short term by multiple factors, including geopolitical tensions in the Middle East, a stronger dollar, and expectations of a Federal Reserve rate hike, fluctuating downwards from a three-week high and approaching the $4,700 mark. The geopolitical situation could escalate further at any time, and with US inflation data due soon, volatility may intensify. Technically, the bullish structure has not been completely broken, and selling pressure lacks sustainability. Gold prices are currently in a tug-of-war between bulls and bears, and future price movements will depend heavily on inflation data and developments in the Middle East.
Spot gold daily chart source: EasyForex
At 15:17 Beijing time on May 12, spot gold was trading at $4696.65 per ounce.
- Risk Warning and Disclaimer
- The market involves risk, and trading may not be suitable for all investors. This article is for reference only and does not constitute personal investment advice, nor does it take into account certain users’ specific investment objectives, financial situation, or other needs. Any investment decisions made based on this information are at your own risk.