Japan's most aggressive share reduction in four years! How much will the central level of US Treasury yields rise in 2026?
2026-05-13 15:58:03
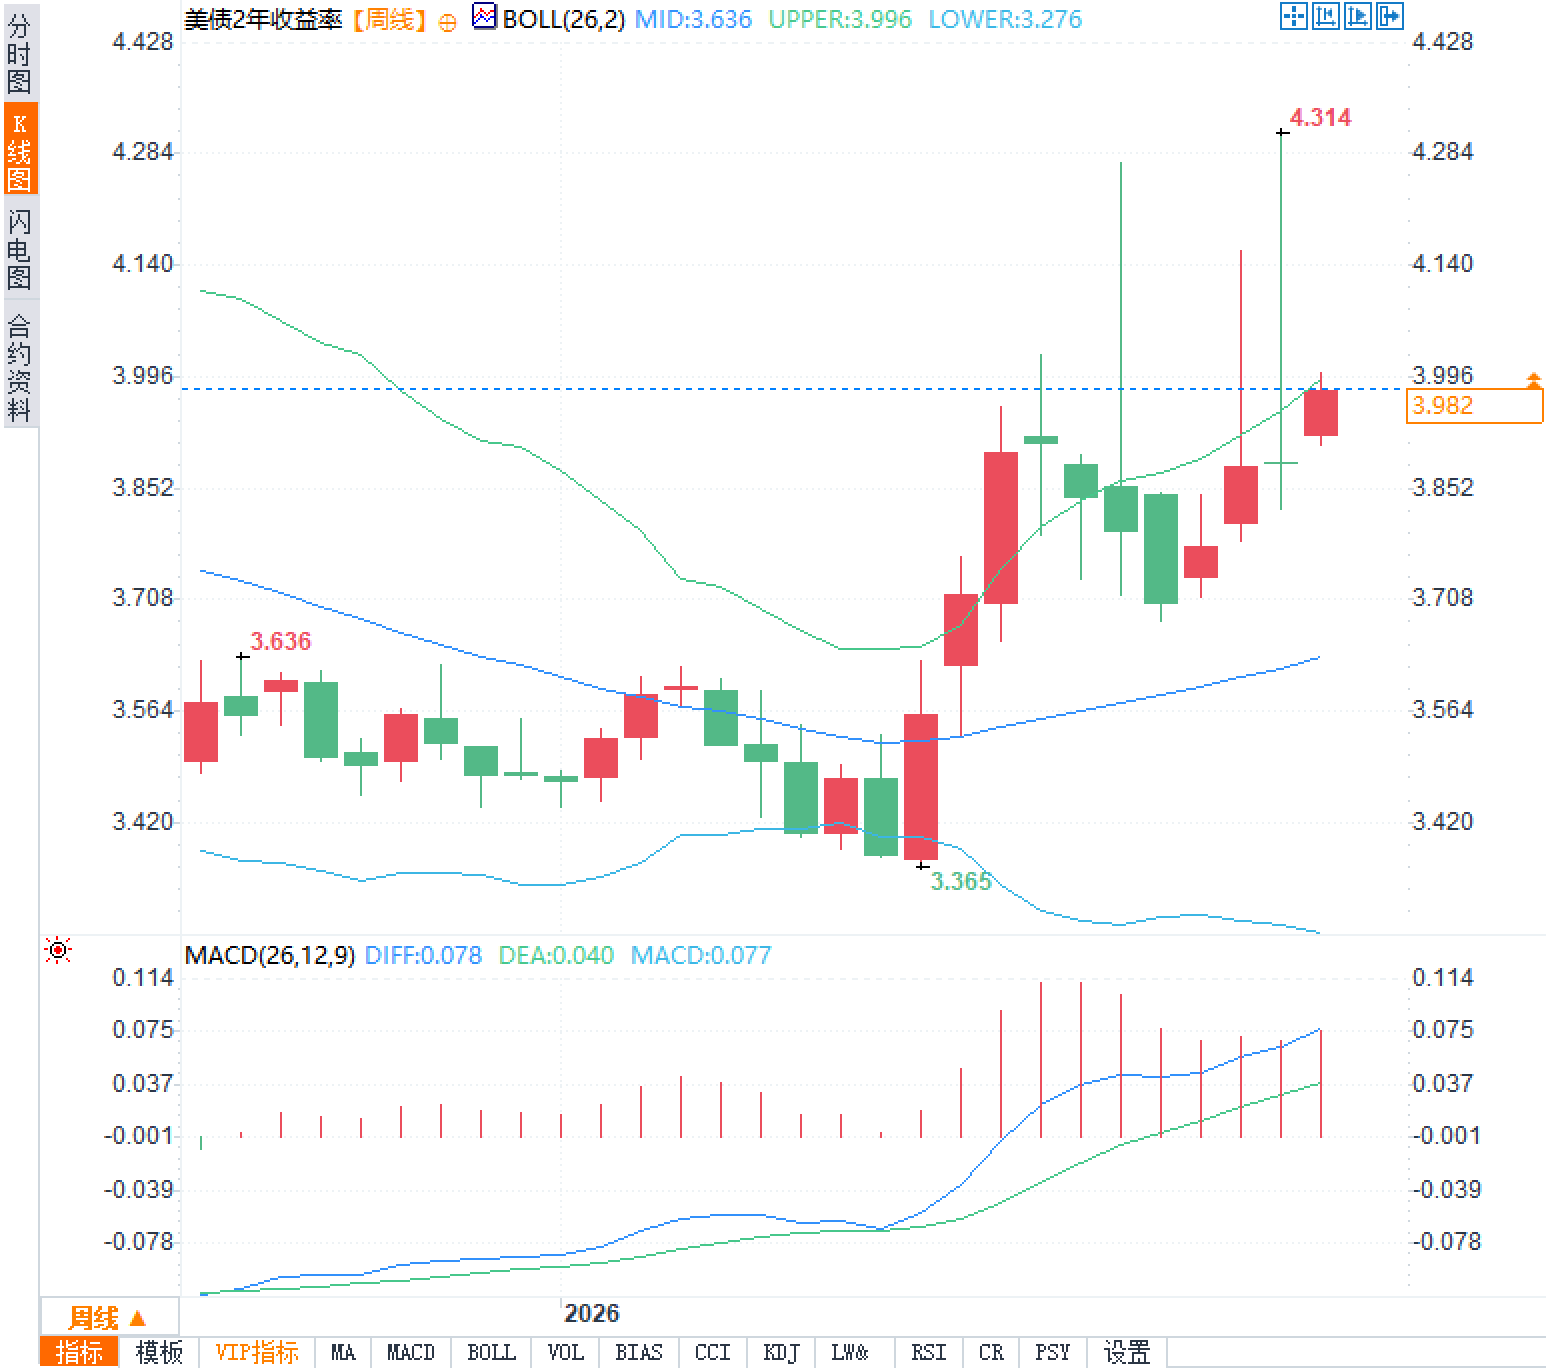
On Wednesday, May 13th, the US Treasury market was at a crossroads between high oil prices and changes in foreign capital flows. The 2-year US Treasury yield recently hovered around 3.98% to 4.00%. The weekly chart shows the Bollinger Bands at 3.996% (upper band), 3.636% (middle band), and 3.276% (lower band), with a recent high of 4.314% before a slight pullback. The MACD indicator (DIFF 0.078, DEA 0.040, MACD histogram 0.077) showed positive and strengthening values, reflecting continued short-term momentum but increased volatility. Meanwhile, Japanese investors net sold 4.67 trillion yen (approximately US$29.6 billion) of US Treasuries in the first quarter, a near four-year high. This trend, coupled with oil prices rising to the $95-$110/barrel range due to geopolitical factors, has led to a shift in the Federal Reserve's policy expectations from the two rate cuts at the beginning of the year to a stable or even higher rate risk, causing a subtle shift in the balance of supply and demand in the market.
As the largest foreign holder of US Treasury bonds, Japan's capital flows have a significant impact on the yield curve, especially the short-term side. According to the latest data on Japan's balance of payments, in the three months ending March 31, Japanese investors net sold a total of 4.67 trillion yen in US government, institutional, and regional bonds, far exceeding the previous quarterly average and reaching the highest level since the second quarter of 2022. Net sales of US Treasury bonds in February alone were approximately 3.42 trillion yen, and net sales of overseas bonds further expanded to 4.12 trillion yen in March, with US Treasury bonds accounting for a significant portion. Meanwhile, data from the US Treasury Department shows that Japan's holdings of US Treasury bonds remained around $1.239 trillion at the end of February, but the net outflow trend was obvious, possibly related to yen intervention operations, with some funds used to obtain dollar liquidity to stabilize the exchange rate.
Nomura Securities strategist Naokazu Koshimizu recently pointed out: "The adjustment in positions is strong, and the outlook is highly uncertain. Not only is the timing of interest rate cuts likely to be significantly delayed, but even whether the next step will be an interest rate hike is uncertain." He further explained that in the past, the market supported buying based on the assumption that interest rate cuts would eventually occur, especially in mortgage-backed securities. However, current oil price-driven inflation expectations have broken this premise, leading to institutions actively reducing their holdings. This large-scale reduction is not an isolated event, but rather the result of the combined effect of rising domestic Japanese bond yields and changes in yen financing costs, directly weakening the traditional demand support for US Treasuries.
The following is a comparison of recent net buying and selling data of Japanese government bonds against the US (unit: trillion yen).
This change in supply and demand directly increased pressure on the secondary market for US Treasuries. Especially with the Federal Reserve maintaining interest rates unchanged at 3.5% to 3.75%, weakening foreign demand could amplify the upward potential of yields.
A roughly 50% jump in oil prices became the core catalyst triggering a reversal in policy expectations. Brent crude oil prices, after briefly approaching $120 per barrel, fell back to above $100 per barrel, with energy costs directly impacting end-product prices such as gasoline and food, pushing up overall inflation expectations. Overnight index swap (OIS) market pricing shifted rapidly from two rate cuts at the beginning of the year to zero or very few rate cuts, even reaching an extreme level of over 50% probability of a rate hike this year. This shift aligns with the tone of recent Federal Reserve meetings: policymakers emphasized data-driven decision-making, prioritizing addressing the risk of renewed inflation rather than premature easing.
Traders observed that oil prices have a particularly direct impact on short-term interest rate sensitive instruments such as 2-year US Treasuries. Rising energy prices not only increase production costs but also amplify the wage-price spiral risk through supply chain transmission, limiting the Federal Reserve's ability to stimulate the economy through interest rate cuts. In contrast, long-term yields are more affected by fiscal supply and global demand, but the short-term yields have already reflected the uncertainty of the policy path. Strategists such as Koshimizu agree that the previous "interest rate cut narrative" supporting buying has become ineffective, and the market is repricing terminal interest rate levels. This process will continue to test the pricing efficiency of US Treasuries.
From a weekly technical perspective, the 2-year US Treasury yield has rebounded strongly from a low of 3.365%, and is currently approaching the upper Bollinger Band at 3.996%, indicating expanding volatility. The MACD indicator's histogram remains positive after a golden cross, and momentum indicators are strengthening, suggesting that bullish forces are still accumulating, but a potential pullback under upper band resistance should be noted. Fundamentally, Japan's share reduction is resonating with inflation concerns triggered by oil prices, pushing the yield center upward.
Traders are paying close attention to the flattening or steepening of the yield curve, while institutional position adjustments can amplify short-term volatility, especially during the Federal Reserve data release window. Overall, weakening foreign demand and renewed inflation are putting upward pressure on US Treasury yields, but the market has not seen panic selling, indicating that participants are still focused on position management rather than directional betting.
The scale and driving factors of Japanese investors reducing their holdings of US Treasury bonds
As the largest foreign holder of US Treasury bonds, Japan's capital flows have a significant impact on the yield curve, especially the short-term side. According to the latest data on Japan's balance of payments, in the three months ending March 31, Japanese investors net sold a total of 4.67 trillion yen in US government, institutional, and regional bonds, far exceeding the previous quarterly average and reaching the highest level since the second quarter of 2022. Net sales of US Treasury bonds in February alone were approximately 3.42 trillion yen, and net sales of overseas bonds further expanded to 4.12 trillion yen in March, with US Treasury bonds accounting for a significant portion. Meanwhile, data from the US Treasury Department shows that Japan's holdings of US Treasury bonds remained around $1.239 trillion at the end of February, but the net outflow trend was obvious, possibly related to yen intervention operations, with some funds used to obtain dollar liquidity to stabilize the exchange rate.
Nomura Securities strategist Naokazu Koshimizu recently pointed out: "The adjustment in positions is strong, and the outlook is highly uncertain. Not only is the timing of interest rate cuts likely to be significantly delayed, but even whether the next step will be an interest rate hike is uncertain." He further explained that in the past, the market supported buying based on the assumption that interest rate cuts would eventually occur, especially in mortgage-backed securities. However, current oil price-driven inflation expectations have broken this premise, leading to institutions actively reducing their holdings. This large-scale reduction is not an isolated event, but rather the result of the combined effect of rising domestic Japanese bond yields and changes in yen financing costs, directly weakening the traditional demand support for US Treasuries.
The following is a comparison of recent net buying and selling data of Japanese government bonds against the US (unit: trillion yen).
| period | Net selling size | Remark |
|---|---|---|
| First quarter of 2026 | 4.67 | Highest in nearly four years |
| Same period in 2025 | Approximately 1.8 | Normal level |
| Second quarter of 2022 | Approximately 3.9 | Historical high |
Soaring oil prices are reshaping expectations for the Federal Reserve's policy path.
A roughly 50% jump in oil prices became the core catalyst triggering a reversal in policy expectations. Brent crude oil prices, after briefly approaching $120 per barrel, fell back to above $100 per barrel, with energy costs directly impacting end-product prices such as gasoline and food, pushing up overall inflation expectations. Overnight index swap (OIS) market pricing shifted rapidly from two rate cuts at the beginning of the year to zero or very few rate cuts, even reaching an extreme level of over 50% probability of a rate hike this year. This shift aligns with the tone of recent Federal Reserve meetings: policymakers emphasized data-driven decision-making, prioritizing addressing the risk of renewed inflation rather than premature easing.
Traders observed that oil prices have a particularly direct impact on short-term interest rate sensitive instruments such as 2-year US Treasuries. Rising energy prices not only increase production costs but also amplify the wage-price spiral risk through supply chain transmission, limiting the Federal Reserve's ability to stimulate the economy through interest rate cuts. In contrast, long-term yields are more affected by fiscal supply and global demand, but the short-term yields have already reflected the uncertainty of the policy path. Strategists such as Koshimizu agree that the previous "interest rate cut narrative" supporting buying has become ineffective, and the market is repricing terminal interest rate levels. This process will continue to test the pricing efficiency of US Treasuries.
Interplay of technical and fundamental factors in the 2-year US Treasury yield
From a weekly technical perspective, the 2-year US Treasury yield has rebounded strongly from a low of 3.365%, and is currently approaching the upper Bollinger Band at 3.996%, indicating expanding volatility. The MACD indicator's histogram remains positive after a golden cross, and momentum indicators are strengthening, suggesting that bullish forces are still accumulating, but a potential pullback under upper band resistance should be noted. Fundamentally, Japan's share reduction is resonating with inflation concerns triggered by oil prices, pushing the yield center upward.
Traders are paying close attention to the flattening or steepening of the yield curve, while institutional position adjustments can amplify short-term volatility, especially during the Federal Reserve data release window. Overall, weakening foreign demand and renewed inflation are putting upward pressure on US Treasury yields, but the market has not seen panic selling, indicating that participants are still focused on position management rather than directional betting.
- Risk Warning and Disclaimer
- The market involves risk, and trading may not be suitable for all investors. This article is for reference only and does not constitute personal investment advice, nor does it take into account certain users’ specific investment objectives, financial situation, or other needs. Any investment decisions made based on this information are at your own risk.