Soaring Treasury yields weighed on gold and silver prices, while the Hormuz negotiations provided a buffer for oil prices.
2026-05-20 00:01:31
On Tuesday (May 19), spot gold and spot silver prices fell during the US trading session. Spot gold was at $4,501.24 per ounce, down 1.42%. Spot silver was at $74.276 per ounce, down 4.33%. Silver has industrial properties, and its price is more sensitive to macroeconomic pessimism. Its higher beta coefficient amplifies the decline when risk appetite weakens.
A stronger dollar and a 10-year Treasury yield approaching 4.6% continued to put pressure on precious metals. Gold hit its lowest level since March 30; silver fell even more, with its industrial properties amplifying the downward volatility. Meanwhile, Trump's suspension of military plans against Iran caused oil prices to decline slightly, but the obstruction of passage through the Strait of Hormuz remained unchanged.

Two signals interacting
The current pricing logic in the precious metals market is driven by two opposing forces. On the one hand, tensions in the Strait of Hormuz remain unresolved, and geopolitical risk premiums continue to support safe-haven demand. On the other hand, bond market movements have become the core anchor for intraday trading. The 10-year US Treasury yield remains around 4.6%, near a one-year high, continuously pushing up the opportunity cost of holding non-yielding assets. The US dollar index has rebounded to approximately 99.33, near a one-month high, further pressuring metals priced in international currencies.
Trump suspends strikes, negotiation window opens
US President Donald Trump announced on Monday that, at the request of several Gulf leaders, he was suspending planned military strikes against Iran to allow room for diplomatic negotiations. In a post on Truth Social, he stated that current progress in negotiations could lead to an agreement beneficial to both the US and the Middle East, with the core objective of ensuring that "Iran cannot possess nuclear weapons." He also warned that if negotiations break down, the US military is prepared to launch a "full-scale, large-scale strike."
As a result, oil prices retreated slightly from their highs, with WTI at approximately $103.97 per barrel and Brent at approximately $111.15 per barrel. However, the situation of actual obstruction of passage through the Strait of Hormuz remained unchanged, and the two benchmark oil prices remained above $100 and $110 respectively. The controversy surrounding Iran's nuclear program has made the prospects for negotiations uncertain, and investors are generally cautious about whether a lasting agreement can be reached.
This situation presents a double-edged sword for gold: geopolitical risks support safe-haven buying, but rising energy prices are pushing up inflation expectations, which in turn drives bond yields higher, creating further downward pressure. Although geopolitical uncertainty is generally beneficial for gold, its price has fallen by nearly 15% since the outbreak of this conflict.
Inflationary pressures drive up expectations of interest rate hikes
Rising oil prices have driven up inflation in major economies, leading to a massive sell-off in the bond market and a sharp rise in government bond yields. This has increased policy pressure on the Federal Reserve. The CME FedWatch tool shows that traders expect the probability of a Fed rate hike of at least 25 basis points by the end of the year, a significant increase from 35% a week ago. The Fed's hawkish stance and the uncertainty surrounding the Iran nuclear negotiations have jointly supported the US dollar, further increasing the cost of gold for foreign buyers and limiting the upside potential of gold prices.
Technical Analysis: Gold is under consolidation pressure.
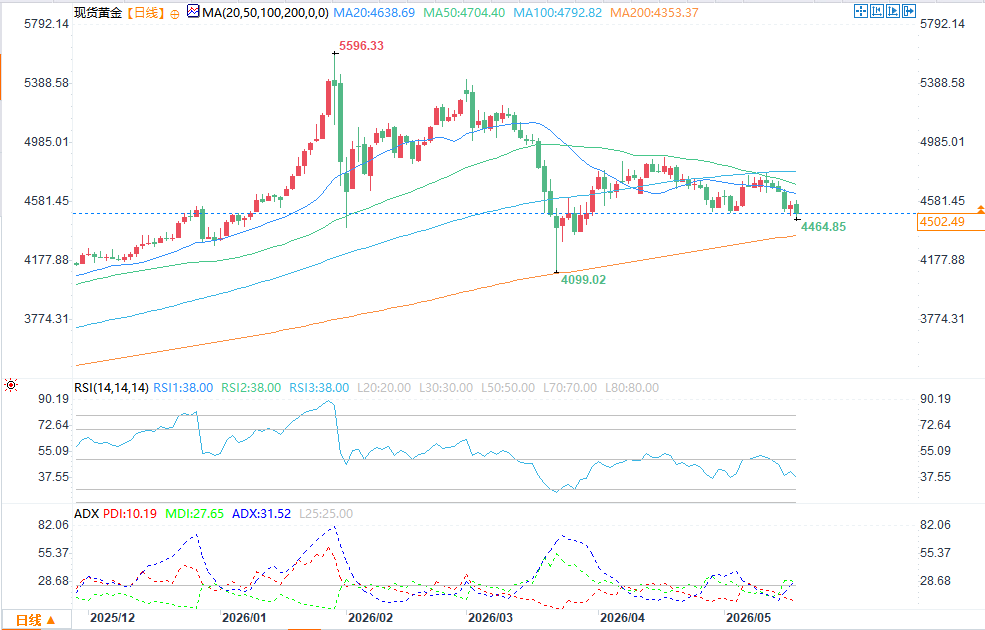
(Spot gold daily chart source: FX678)
From the daily chart, gold prices have broken below the 50-day and 100-day simple moving averages (approximately $4705 and $4793 respectively), where sellers are providing significant resistance. The RSI is around 40, indicating weakening momentum but not yet reaching oversold territory. The daily ADX for gold is currently in a clear downtrend, with a "medium to strong" trend strength (ADX=31.52, not yet above the overbought level of 50, suggesting further downside potential). Despite pressure from short-term moving averages, the 200-day moving average is still providing long-term trend support around $4358, and the overall upward structure remains intact.
Key resistance levels are at $4,540 and $4,572. A sustained break above these levels would target $4,600 and even $4,629. Support is initially seen at $4,481. A break below this level would target $4,400 and the 200-day moving average at $4,358.
Technical Analysis: Silver is under short-term pressure.
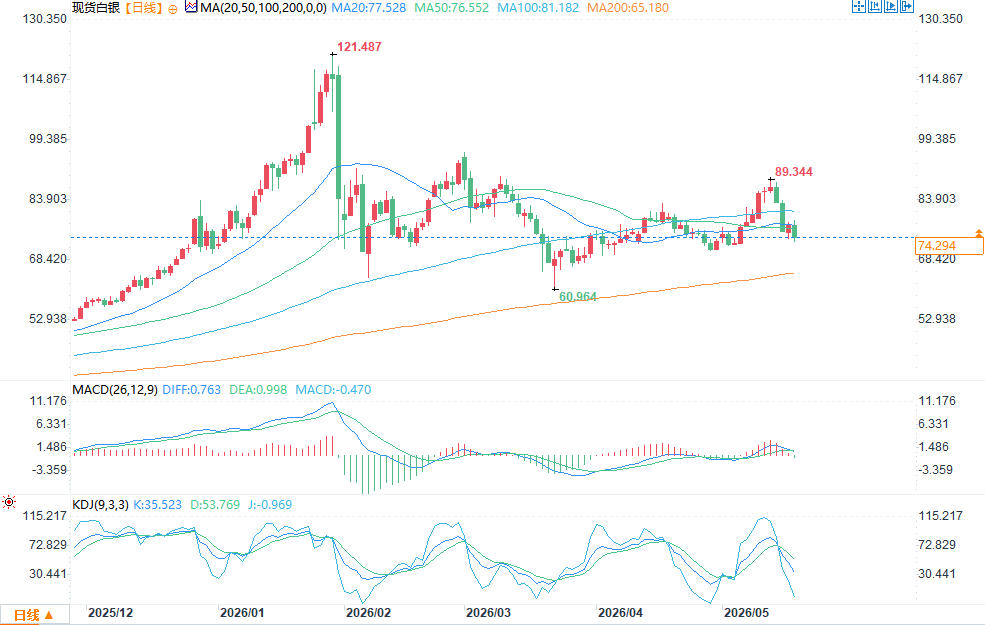
(Spot silver daily chart source: EasyTrade)
Silver's technical outlook is also weak. Bulls need to recover $76.28 to open up further upside potential, with stronger resistance at $77.56. A break above this level would target the $78-$79.82 range. Initial support is seen at $75.21, with the psychological level of $75 forming a second line of defense. A further breach of this level would provide deeper support at $73.86.
Today's Focus
Pending home sales data will be released at 10:00 AM ET on Tuesday, which will be used by the market to assess the trend of US domestic demand. Other important events this week include: the FOMC meeting minutes on Wednesday, the preliminary May Purchasing Managers' Index (PMI) on Thursday, and the University of Michigan Consumer Sentiment Survey on Friday. Progress in US-Iran negotiations and tanker activity in the Strait of Hormuz will continue to be key variables influencing sentiment in the precious metals, energy, and bond markets.
A stronger dollar and a 10-year Treasury yield approaching 4.6% continued to put pressure on precious metals. Gold hit its lowest level since March 30; silver fell even more, with its industrial properties amplifying the downward volatility. Meanwhile, Trump's suspension of military plans against Iran caused oil prices to decline slightly, but the obstruction of passage through the Strait of Hormuz remained unchanged.
Two signals interacting
The current pricing logic in the precious metals market is driven by two opposing forces. On the one hand, tensions in the Strait of Hormuz remain unresolved, and geopolitical risk premiums continue to support safe-haven demand. On the other hand, bond market movements have become the core anchor for intraday trading. The 10-year US Treasury yield remains around 4.6%, near a one-year high, continuously pushing up the opportunity cost of holding non-yielding assets. The US dollar index has rebounded to approximately 99.33, near a one-month high, further pressuring metals priced in international currencies.
Trump suspends strikes, negotiation window opens
US President Donald Trump announced on Monday that, at the request of several Gulf leaders, he was suspending planned military strikes against Iran to allow room for diplomatic negotiations. In a post on Truth Social, he stated that current progress in negotiations could lead to an agreement beneficial to both the US and the Middle East, with the core objective of ensuring that "Iran cannot possess nuclear weapons." He also warned that if negotiations break down, the US military is prepared to launch a "full-scale, large-scale strike."
As a result, oil prices retreated slightly from their highs, with WTI at approximately $103.97 per barrel and Brent at approximately $111.15 per barrel. However, the situation of actual obstruction of passage through the Strait of Hormuz remained unchanged, and the two benchmark oil prices remained above $100 and $110 respectively. The controversy surrounding Iran's nuclear program has made the prospects for negotiations uncertain, and investors are generally cautious about whether a lasting agreement can be reached.
This situation presents a double-edged sword for gold: geopolitical risks support safe-haven buying, but rising energy prices are pushing up inflation expectations, which in turn drives bond yields higher, creating further downward pressure. Although geopolitical uncertainty is generally beneficial for gold, its price has fallen by nearly 15% since the outbreak of this conflict.
Inflationary pressures drive up expectations of interest rate hikes
Rising oil prices have driven up inflation in major economies, leading to a massive sell-off in the bond market and a sharp rise in government bond yields. This has increased policy pressure on the Federal Reserve. The CME FedWatch tool shows that traders expect the probability of a Fed rate hike of at least 25 basis points by the end of the year, a significant increase from 35% a week ago. The Fed's hawkish stance and the uncertainty surrounding the Iran nuclear negotiations have jointly supported the US dollar, further increasing the cost of gold for foreign buyers and limiting the upside potential of gold prices.
Technical Analysis: Gold is under consolidation pressure.
(Spot gold daily chart source: FX678)
From the daily chart, gold prices have broken below the 50-day and 100-day simple moving averages (approximately $4705 and $4793 respectively), where sellers are providing significant resistance. The RSI is around 40, indicating weakening momentum but not yet reaching oversold territory. The daily ADX for gold is currently in a clear downtrend, with a "medium to strong" trend strength (ADX=31.52, not yet above the overbought level of 50, suggesting further downside potential). Despite pressure from short-term moving averages, the 200-day moving average is still providing long-term trend support around $4358, and the overall upward structure remains intact.
Key resistance levels are at $4,540 and $4,572. A sustained break above these levels would target $4,600 and even $4,629. Support is initially seen at $4,481. A break below this level would target $4,400 and the 200-day moving average at $4,358.
Technical Analysis: Silver is under short-term pressure.
(Spot silver daily chart source: EasyTrade)
Silver's technical outlook is also weak. Bulls need to recover $76.28 to open up further upside potential, with stronger resistance at $77.56. A break above this level would target the $78-$79.82 range. Initial support is seen at $75.21, with the psychological level of $75 forming a second line of defense. A further breach of this level would provide deeper support at $73.86.
Today's Focus
Pending home sales data will be released at 10:00 AM ET on Tuesday, which will be used by the market to assess the trend of US domestic demand. Other important events this week include: the FOMC meeting minutes on Wednesday, the preliminary May Purchasing Managers' Index (PMI) on Thursday, and the University of Michigan Consumer Sentiment Survey on Friday. Progress in US-Iran negotiations and tanker activity in the Strait of Hormuz will continue to be key variables influencing sentiment in the precious metals, energy, and bond markets.
- Risk Warning and Disclaimer
- The market involves risk, and trading may not be suitable for all investors. This article is for reference only and does not constitute personal investment advice, nor does it take into account certain users’ specific investment objectives, financial situation, or other needs. Any investment decisions made based on this information are at your own risk.