The ongoing Hormuz crisis and the subsequent rebound in oil prices conceal multiple hidden risks.
2026-05-28 10:50:01
International oil prices rebounded slightly after plunging more than 5% on Wednesday (May 27) due to the latest round of US military strikes against Iran and the ongoing stalemate in the Strait of Hormuz. Currently, US crude oil futures are up more than 2% from Wednesday's settlement price to $90.70 per barrel.
Despite market bets that the two sides in the conflict may reach a temporary agreement and oil prices may fall for the second consecutive week, escalating geopolitical tensions, widening negotiation differences, declining inventories, and the looming inflection point in future supply and demand mean that risks in the oil market continue to accumulate. If supply disruptions continue for an extended period, they could reignite inflation and force global central banks to raise interest rates.

As the US and Iran remain deadlocked over the resumption of navigation in the Strait of Hormuz, the US launched a new round of military strikes against Iran, directly pushing up oil prices.
The previous trading day saw international oil prices plummet by more than 5%. Currently, Brent crude oil prices have risen above $93 per barrel, while West Texas Intermediate crude oil prices are around $90 per barrel.
According to official U.S. sources, the targets of this strike were facilities in Iran that threatened U.S. forces and navigation in the Strait of Hormuz; earlier this week, the U.S. military had already attacked targets around the Strait of Hormuz.
Despite market optimism that a temporary agreement might be reached, significant differences remain in the US-Iran negotiations, with core issues proving difficult to resolve. The sticking points include Iran's nuclear program and Iran's insistence on retaining control of the Strait of Hormuz, which remains under a dual blockade by the US and Iran.
President Trump made it clear that he was “dissatisfied” with the negotiations, refused to sign a “bad deal,” and insisted on not easing sanctions against Iran, which is completely contrary to Iran’s demands for a ceasefire and the lifting of economic sanctions.
In addition, Trump is facing pressure from Republican hardliners to continue military operations, which have lasted for nearly four months since the conflict began in late February.
While the market is optimistic about the likelihood of a pricing agreement being reached, institutions are generally warning of the risks.
Chris Weston, head of research at Petterston Group, said the market is betting on an agreement with a "half-full optimism," but the risk of a breakdown in negotiations remains clear. Oil prices are still highly likely to record a second consecutive week of decline, mainly supported by market optimism regarding a temporary agreement.
U.S. crude oil inventories continued to decline, further disrupting market supply and demand. The American Petroleum Institute reported that U.S. crude oil inventories fell by 2.8 million barrels last week, with inventories at the Cushing, Oklahoma delivery hub also declining. Official inventory data will be released on Thursday.
Rabobank global energy strategist Joe Delaura points out that the current oil market is overly optimistic. The release of strategic petroleum reserves and the sharp decline in Chinese imports have temporarily buffered the supply losses caused by the conflict. However, it is expected that if the release of strategic petroleum reserves ends and China resumes imports in mid-July, refined oil prices will see a sharp upward turning point, and oil prices may jump significantly.
If the conflict continues and no settlement agreement is reached, the oil supply disruption will become protracted, triggering a chain reaction in the financial markets. Since the conflict erupted at the end of February, supply disruptions have reignited inflation, pushing bond yields up sharply. If the supply disturbances persist, central banks around the world, including the Federal Reserve, may eventually be forced to raise interest rates, further impacting financial markets.
In the short term, escalating geopolitical conflicts and the blockade of the Taiwan Strait are the core drivers of the oil price rebound, with negotiation disagreements and inventory changes jointly dominating market sentiment. In the medium term, the current optimism in the oil market harbors hidden risks. If supply disruptions become prolonged, they will trigger a chain reaction of rising inflation and interest rate hikes, and the global energy and financial markets will still face high uncertainty.
From the daily chart, the current technical outlook for US crude oil is weak.
In terms of moving averages, the price has broken below the 20-day moving average (98.60) and the 50-day moving average (97.70), and is currently around 90.20, testing the previous low of 87.77 as support. Short-term moving averages are turning downwards, putting downward pressure on the price, and the trend has shifted from strong to weak.
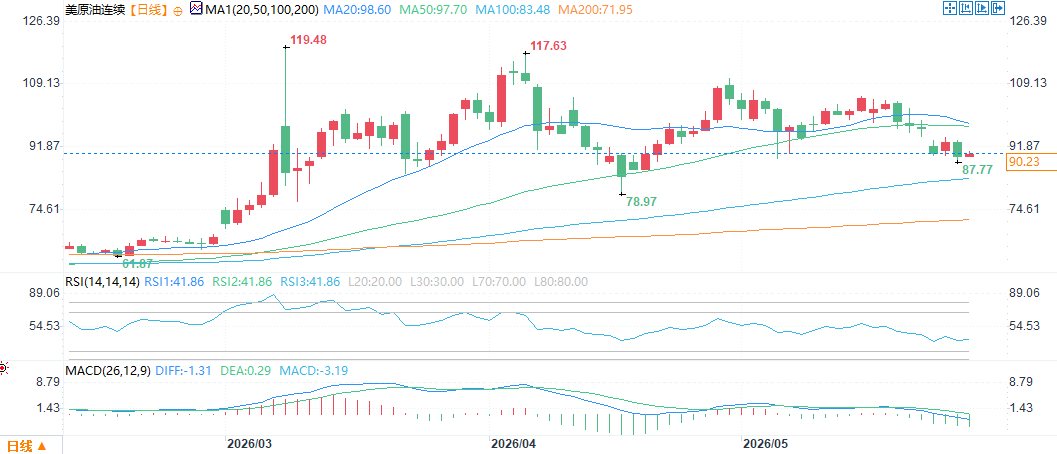
(US crude oil futures daily chart, source: FX678)
RSI indicator: value 41.86, below the 50 neutral line, indicating weak market momentum. It has not yet entered the oversold zone and still has room to fall.
MACD indicator: The DIFF line (-1.31) crossed below the DEA line (0.29), forming a death cross. The MACD histogram is -3.20, indicating that the bearish force continues to be released and the downward momentum has not yet shown obvious signs of exhaustion.
Overall, oil prices are in a short-term correction phase, with key support at 87.77. A break below this level could lead to further declines. Resistance is near the 20-day moving average; failure to break above this level would perpetuate the weak trend.
At 10:48 AM Beijing time on May 28, US crude oil futures were trading at $90.70 per barrel.
Despite market bets that the two sides in the conflict may reach a temporary agreement and oil prices may fall for the second consecutive week, escalating geopolitical tensions, widening negotiation differences, declining inventories, and the looming inflection point in future supply and demand mean that risks in the oil market continue to accumulate. If supply disruptions continue for an extended period, they could reignite inflation and force global central banks to raise interest rates.
Geopolitical conflict escalates: US military launches new strikes, oil prices rebound after decline.
As the US and Iran remain deadlocked over the resumption of navigation in the Strait of Hormuz, the US launched a new round of military strikes against Iran, directly pushing up oil prices.
The previous trading day saw international oil prices plummet by more than 5%. Currently, Brent crude oil prices have risen above $93 per barrel, while West Texas Intermediate crude oil prices are around $90 per barrel.
According to official U.S. sources, the targets of this strike were facilities in Iran that threatened U.S. forces and navigation in the Strait of Hormuz; earlier this week, the U.S. military had already attacked targets around the Strait of Hormuz.
Negotiations stalled: core differences remain unresolved, and the interim agreement faces uncertainties.
Despite market optimism that a temporary agreement might be reached, significant differences remain in the US-Iran negotiations, with core issues proving difficult to resolve. The sticking points include Iran's nuclear program and Iran's insistence on retaining control of the Strait of Hormuz, which remains under a dual blockade by the US and Iran.
President Trump made it clear that he was “dissatisfied” with the negotiations, refused to sign a “bad deal,” and insisted on not easing sanctions against Iran, which is completely contrary to Iran’s demands for a ceasefire and the lifting of economic sanctions.
In addition, Trump is facing pressure from Republican hardliners to continue military operations, which have lasted for nearly four months since the conflict began in late February.
Market View: Despite Optimism, the Risk of Negotiation Breakdown Remains
While the market is optimistic about the likelihood of a pricing agreement being reached, institutions are generally warning of the risks.
Chris Weston, head of research at Petterston Group, said the market is betting on an agreement with a "half-full optimism," but the risk of a breakdown in negotiations remains clear. Oil prices are still highly likely to record a second consecutive week of decline, mainly supported by market optimism regarding a temporary agreement.
Inventory and Supply & Demand: Declining US Inventories Hint at Future Price Inflection Point
U.S. crude oil inventories continued to decline, further disrupting market supply and demand. The American Petroleum Institute reported that U.S. crude oil inventories fell by 2.8 million barrels last week, with inventories at the Cushing, Oklahoma delivery hub also declining. Official inventory data will be released on Thursday.
Rabobank global energy strategist Joe Delaura points out that the current oil market is overly optimistic. The release of strategic petroleum reserves and the sharp decline in Chinese imports have temporarily buffered the supply losses caused by the conflict. However, it is expected that if the release of strategic petroleum reserves ends and China resumes imports in mid-July, refined oil prices will see a sharp upward turning point, and oil prices may jump significantly.
Hidden Impacts: Supply disruptions could exacerbate inflation, forcing central banks to raise interest rates.
If the conflict continues and no settlement agreement is reached, the oil supply disruption will become protracted, triggering a chain reaction in the financial markets. Since the conflict erupted at the end of February, supply disruptions have reignited inflation, pushing bond yields up sharply. If the supply disturbances persist, central banks around the world, including the Federal Reserve, may eventually be forced to raise interest rates, further impacting financial markets.
In the short term, escalating geopolitical conflicts and the blockade of the Taiwan Strait are the core drivers of the oil price rebound, with negotiation disagreements and inventory changes jointly dominating market sentiment. In the medium term, the current optimism in the oil market harbors hidden risks. If supply disruptions become prolonged, they will trigger a chain reaction of rising inflation and interest rate hikes, and the global energy and financial markets will still face high uncertainty.
From the daily chart, the current technical outlook for US crude oil is weak.
In terms of moving averages, the price has broken below the 20-day moving average (98.60) and the 50-day moving average (97.70), and is currently around 90.20, testing the previous low of 87.77 as support. Short-term moving averages are turning downwards, putting downward pressure on the price, and the trend has shifted from strong to weak.
(US crude oil futures daily chart, source: FX678)
RSI indicator: value 41.86, below the 50 neutral line, indicating weak market momentum. It has not yet entered the oversold zone and still has room to fall.
MACD indicator: The DIFF line (-1.31) crossed below the DEA line (0.29), forming a death cross. The MACD histogram is -3.20, indicating that the bearish force continues to be released and the downward momentum has not yet shown obvious signs of exhaustion.
Overall, oil prices are in a short-term correction phase, with key support at 87.77. A break below this level could lead to further declines. Resistance is near the 20-day moving average; failure to break above this level would perpetuate the weak trend.
At 10:48 AM Beijing time on May 28, US crude oil futures were trading at $90.70 per barrel.
- Risk Warning and Disclaimer
- The market involves risk, and trading may not be suitable for all investors. This article is for reference only and does not constitute personal investment advice, nor does it take into account certain users’ specific investment objectives, financial situation, or other needs. Any investment decisions made based on this information are at your own risk.