Institutions predict silver could reach $100 this year, but the upward trend is unlikely to continue.
2026-05-28 11:01:40
Silver prices are currently hovering below $75 per ounce, with little upward momentum in the market.
Bank of America analysts predict that silver prices could reach $100 per ounce this year, driven by gold prices, but this rally lacks fundamental support and is unlikely to be sustained in the long term. Influenced by multiple factors such as declining industrial demand, shifts in the supply-demand balance, expectations surrounding Federal Reserve policy, and North American trade negotiations, silver prices are expected to experience increased volatility, with a high probability of a medium- to long-term decline, and the investment logic will gradually change.
Michael Widmer, head of metals research at Bank of America, led his team to release a precious metals analysis report, providing an assessment of the short-term trend of silver.
The team stated that, driven by the gold market, silver prices are expected to reach $100 per ounce in the coming months . However, analysts also clarified that due to weakening industrial fundamentals, silver cannot outperform gold in the long term. Looking at a longer timeframe, they predict that by the second quarter of 2027, silver prices will fall back to around $75 per ounce, returning to a generally range-bound pattern.
Shrinking industrial demand is the core factor suppressing silver prices .
The continued rise in silver prices has significantly squeezed the profits of manufacturing companies, prompting major industrial sectors to proactively reduce their silver usage or adopt cheaper alternatives. Analysts say that industrial demand for silver peaked last year, and the slowdown in domestic photovoltaic capacity growth and the potential decline in annual installed capacity have further dragged down silver demand. Limited increases in demand from other industries are insufficient to offset the overall downward pressure.
Due to reduced silver consumption by businesses and contracting demand, the silver supply-demand gap is expected to narrow by 90% this year. The market supply and demand are already trending towards equilibrium by 2026; however, if investors engage in even small-scale selling, silver will completely shift from a supply shortage to a supply surplus, leading to a fundamental reversal.
Against this backdrop, the industrial attributes of silver are gradually weakening, and its future price trends will be more driven by investment behavior.
Silver previously outperformed gold, primarily due to a five-year-long industrial supply-demand gap, a tight balance expected to continue into the sixth year. Gold, as a non-interest-bearing monetary asset, is currently under pressure, with the market widely anticipating another interest rate hike by the Federal Reserve this year. This rising opportunity cost of holding gold is limiting its upside potential.
The current gold-silver ratio is 59.43, which is in the middle of a range that has been fluctuating for several months, and the two precious metals show a clear divergence in their price movements.
Industry insiders added that silver is irreplaceable in the photovoltaic industry, so demand is not expected to plummet. Furthermore, the situation in Iran is driving the development of clean energy, providing some support for silver. However, these positive factors are weak and unlikely to reverse the overall trend.
Insufficient liquidity in certain areas of the silver market naturally exacerbates price volatility.
At the beginning of this year, tight physical silver supply led to fierce competition among industrial and investment funds, pushing silver prices up to $120 per ounce. Now, the resumption of negotiations for the North American Free Trade Agreement (NAFTA) has become a new risk factor. Canada and Mexico are major silver suppliers to the United States, and the uncertain prospects for trade negotiations, coupled with the impact of past tariff policies, have led market players to hoard inventory, exacerbating the global physical silver supply shortage and previously pushing silver prices back above $80 per ounce.
At the same time, the size of physical silver ETFs continued to shrink, and investors in the futures market showed little willingness to increase their long positions. This round of price rebound was not caused by funds actively going long, and the market's foundation was not solid.
In summary, while silver may have room for a short-term rebound, declining industrial demand and a reversal in the supply-demand balance pose long-term risks. External variables such as expectations of a Fed rate hike and North American trade negotiations further amplify market uncertainty, significantly increasing the risk of price volatility.
Even if silver prices surge this year, it will only be a temporary phenomenon, and the probability of them returning to lower levels in the medium to long term is extremely high. Investors should view this rebound rationally and be wary of the risk of a rapid decline in prices.
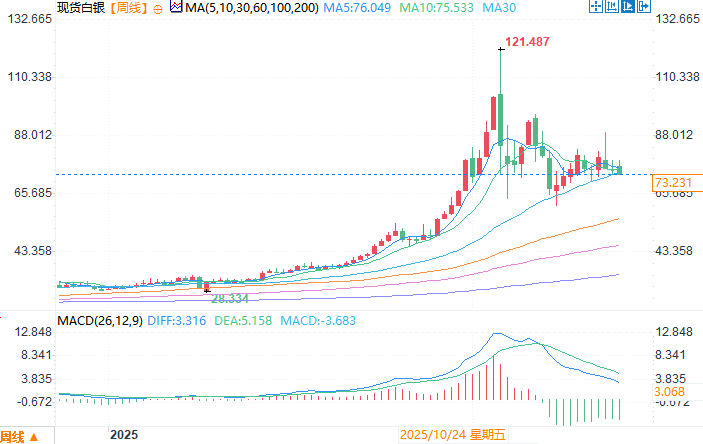
Spot silver weekly chart source: EasyForex
At 11:01 AM Beijing time on May 28, spot silver was trading at $73.03 per ounce.
Bank of America analysts predict that silver prices could reach $100 per ounce this year, driven by gold prices, but this rally lacks fundamental support and is unlikely to be sustained in the long term. Influenced by multiple factors such as declining industrial demand, shifts in the supply-demand balance, expectations surrounding Federal Reserve policy, and North American trade negotiations, silver prices are expected to experience increased volatility, with a high probability of a medium- to long-term decline, and the investment logic will gradually change.
There is a short-term rebound opportunity, but the sustainability of the upward trend is questionable.
Michael Widmer, head of metals research at Bank of America, led his team to release a precious metals analysis report, providing an assessment of the short-term trend of silver.
The team stated that, driven by the gold market, silver prices are expected to reach $100 per ounce in the coming months . However, analysts also clarified that due to weakening industrial fundamentals, silver cannot outperform gold in the long term. Looking at a longer timeframe, they predict that by the second quarter of 2027, silver prices will fall back to around $75 per ounce, returning to a generally range-bound pattern.
Weakening industrial demand has led to a reversal in the supply-demand balance.
Shrinking industrial demand is the core factor suppressing silver prices .
The continued rise in silver prices has significantly squeezed the profits of manufacturing companies, prompting major industrial sectors to proactively reduce their silver usage or adopt cheaper alternatives. Analysts say that industrial demand for silver peaked last year, and the slowdown in domestic photovoltaic capacity growth and the potential decline in annual installed capacity have further dragged down silver demand. Limited increases in demand from other industries are insufficient to offset the overall downward pressure.
Due to reduced silver consumption by businesses and contracting demand, the silver supply-demand gap is expected to narrow by 90% this year. The market supply and demand are already trending towards equilibrium by 2026; however, if investors engage in even small-scale selling, silver will completely shift from a supply shortage to a supply surplus, leading to a fundamental reversal.
Against this backdrop, the industrial attributes of silver are gradually weakening, and its future price trends will be more driven by investment behavior.
Gold and silver prices diverged, with interest rate factors impacting gold prices.
Silver previously outperformed gold, primarily due to a five-year-long industrial supply-demand gap, a tight balance expected to continue into the sixth year. Gold, as a non-interest-bearing monetary asset, is currently under pressure, with the market widely anticipating another interest rate hike by the Federal Reserve this year. This rising opportunity cost of holding gold is limiting its upside potential.
The current gold-silver ratio is 59.43, which is in the middle of a range that has been fluctuating for several months, and the two precious metals show a clear divergence in their price movements.
Industry insiders added that silver is irreplaceable in the photovoltaic industry, so demand is not expected to plummet. Furthermore, the situation in Iran is driving the development of clean energy, providing some support for silver. However, these positive factors are weak and unlikely to reverse the overall trend.
Liquidity and trade risks are intertwined, leading to increased market volatility.
Insufficient liquidity in certain areas of the silver market naturally exacerbates price volatility.
At the beginning of this year, tight physical silver supply led to fierce competition among industrial and investment funds, pushing silver prices up to $120 per ounce. Now, the resumption of negotiations for the North American Free Trade Agreement (NAFTA) has become a new risk factor. Canada and Mexico are major silver suppliers to the United States, and the uncertain prospects for trade negotiations, coupled with the impact of past tariff policies, have led market players to hoard inventory, exacerbating the global physical silver supply shortage and previously pushing silver prices back above $80 per ounce.
At the same time, the size of physical silver ETFs continued to shrink, and investors in the futures market showed little willingness to increase their long positions. This round of price rebound was not caused by funds actively going long, and the market's foundation was not solid.
Summarize
In summary, while silver may have room for a short-term rebound, declining industrial demand and a reversal in the supply-demand balance pose long-term risks. External variables such as expectations of a Fed rate hike and North American trade negotiations further amplify market uncertainty, significantly increasing the risk of price volatility.
Even if silver prices surge this year, it will only be a temporary phenomenon, and the probability of them returning to lower levels in the medium to long term is extremely high. Investors should view this rebound rationally and be wary of the risk of a rapid decline in prices.
Spot silver weekly chart source: EasyForex
At 11:01 AM Beijing time on May 28, spot silver was trading at $73.03 per ounce.
- Risk Warning and Disclaimer
- The market involves risk, and trading may not be suitable for all investors. This article is for reference only and does not constitute personal investment advice, nor does it take into account certain users’ specific investment objectives, financial situation, or other needs. Any investment decisions made based on this information are at your own risk.