The Australian dollar ignored positive trade balance news, with geopolitical risk aversion becoming a major obstacle.
2026-06-04 13:07:24
On Thursday (June 4) during the Asian session, the Australian dollar traded in a volatile range against the US dollar after opening, and is currently trading around 0.7125 after a slight pullback.
The fundamental news and the market trend are subtly contrasting – the trade balance data turned significantly positive, but the Australian dollar did not take advantage of the situation to strengthen.

According to the latest foreign trade data released by the Australian Bureau of Statistics on Thursday, Australia's trade balance turned into a surplus of A$179.1 billion in April, compared to a revised deficit of A$102.4 billion the previous month, and was roughly in line with market expectations of A$180 billion. This turnaround marks the return of Australia's external sector to a surplus after a brief period of deterioration.
Looking at the detailed data, Australia's exports rose 7.2% month-on-month in April, a strong reversal from the 2.5% decline in the previous month, reaching a recent high. This was mainly due to high commodity prices and a recovery in demand from some trading partners. Meanwhile, imports rose only 0.8% month-on-month in April, a significant slowdown from March's 12.2%.
The sharp rebound in exports was the main driver of the trade balance turning positive, while the significant slowdown in import growth suggests that domestic demand is cooling – consumers are tightening their spending in a high-inflation and high-interest-rate environment, and businesses may also postpone investment plans.
Overall, April's trade data showed a pattern of "strong external demand and weak domestic demand": strong exports were beneficial to the Australian dollar, but weak domestic demand may limit the Reserve Bank of Australia's room for further interest rate hikes, thus constraining the Australian dollar.
Trade balance data provides an early signal of net export performance. Export data reflects important information about Australia's economic growth, while import data indicates the strength of domestic demand.
Although the impact of trade data on the Reserve Bank of Australia's (RBA) policy is usually indirect, it can still provide valuable insights by revealing the strength of the external sector, the state of economic growth, and national income.
A narrowing trade surplus or an unexpected deficit could signal weaker export demand or slower growth among major trading partners. This could lead the market to expect a more dovish stance from the Reserve Bank of Australia. However, if risk sentiment improves, capital flows into risk assets could still limit the Australian dollar's decline.
A trade surplus higher than expected may indicate strong export demand or a resilient economy. Such data could lead market expectations that the Reserve Bank of Australia will raise interest rates or maintain high interest rates.
UOB strategists expect the exchange rate to consolidate within the 0.7120 to 0.7205 range in the short term. From a broader technical perspective, if the 0.6850-0.6870 support level is breached, the Australian dollar could fall further to 0.6765 against the US dollar.
Market analysts believe that improved trade balance data typically indicates strong export demand or a resilient economy, which could lead to market expectations that the Reserve Bank of Australia (RBA) will raise interest rates or maintain high interest rates, thus supporting the Australian dollar. However, the Australian dollar retreated again after the data release, showing a relatively restrained reaction. This was partly due to continued geopolitical tensions in the Middle East (Iranian officials stated that war negotiations had not made "substantial progress") providing safe-haven support for the US dollar, limiting the upside potential of the Australian dollar.
The daily chart shows that the Australian dollar against the US dollar is in a well-maintained upward trend. The price is currently around 0.7125, close to the 50-day moving average (MA50) and under pressure below the 20-day moving average (MA20). The medium- and long-term moving averages continue to rise, providing support. After gradually rising from the lows, the price is oscillating in a high-level range of 0.7120-0.7277. A break above the previous high would indicate continued upward movement, while a break below the MA50 would likely lead to a pullback to the MA100.
(AUD/USD daily chart, source: FX678)
The MACD lines are converging near the zero line and slightly turning green, indicating a balance between bullish and bearish momentum awaiting a breakout. The RSI is in the neutral range of 45, with no overbought or oversold conditions, suggesting short-term range-bound trading. The overall market is consolidating within an upward trend, and trading should focus on identifying opportunities based on breakouts from the upper or lower limits of the trading range.
At 13:06 Beijing time on June 4, the Australian dollar was trading at 0.7127/28 against the US dollar.
The fundamental news and the market trend are subtly contrasting – the trade balance data turned significantly positive, but the Australian dollar did not take advantage of the situation to strengthen.
Import and export data details
According to the latest foreign trade data released by the Australian Bureau of Statistics on Thursday, Australia's trade balance turned into a surplus of A$179.1 billion in April, compared to a revised deficit of A$102.4 billion the previous month, and was roughly in line with market expectations of A$180 billion. This turnaround marks the return of Australia's external sector to a surplus after a brief period of deterioration.
Looking at the detailed data, Australia's exports rose 7.2% month-on-month in April, a strong reversal from the 2.5% decline in the previous month, reaching a recent high. This was mainly due to high commodity prices and a recovery in demand from some trading partners. Meanwhile, imports rose only 0.8% month-on-month in April, a significant slowdown from March's 12.2%.
The sharp rebound in exports was the main driver of the trade balance turning positive, while the significant slowdown in import growth suggests that domestic demand is cooling – consumers are tightening their spending in a high-inflation and high-interest-rate environment, and businesses may also postpone investment plans.
Overall, April's trade data showed a pattern of "strong external demand and weak domestic demand": strong exports were beneficial to the Australian dollar, but weak domestic demand may limit the Reserve Bank of Australia's room for further interest rate hikes, thus constraining the Australian dollar.
What do trade data mean for the Australian dollar?
Trade balance data provides an early signal of net export performance. Export data reflects important information about Australia's economic growth, while import data indicates the strength of domestic demand.
Although the impact of trade data on the Reserve Bank of Australia's (RBA) policy is usually indirect, it can still provide valuable insights by revealing the strength of the external sector, the state of economic growth, and national income.
A narrowing trade surplus or an unexpected deficit could signal weaker export demand or slower growth among major trading partners. This could lead the market to expect a more dovish stance from the Reserve Bank of Australia. However, if risk sentiment improves, capital flows into risk assets could still limit the Australian dollar's decline.
A trade surplus higher than expected may indicate strong export demand or a resilient economy. Such data could lead market expectations that the Reserve Bank of Australia will raise interest rates or maintain high interest rates.
The positive impact of the trade balance was offset by risk aversion.
UOB strategists expect the exchange rate to consolidate within the 0.7120 to 0.7205 range in the short term. From a broader technical perspective, if the 0.6850-0.6870 support level is breached, the Australian dollar could fall further to 0.6765 against the US dollar.
Market analysts believe that improved trade balance data typically indicates strong export demand or a resilient economy, which could lead to market expectations that the Reserve Bank of Australia (RBA) will raise interest rates or maintain high interest rates, thus supporting the Australian dollar. However, the Australian dollar retreated again after the data release, showing a relatively restrained reaction. This was partly due to continued geopolitical tensions in the Middle East (Iranian officials stated that war negotiations had not made "substantial progress") providing safe-haven support for the US dollar, limiting the upside potential of the Australian dollar.
Technical Analysis
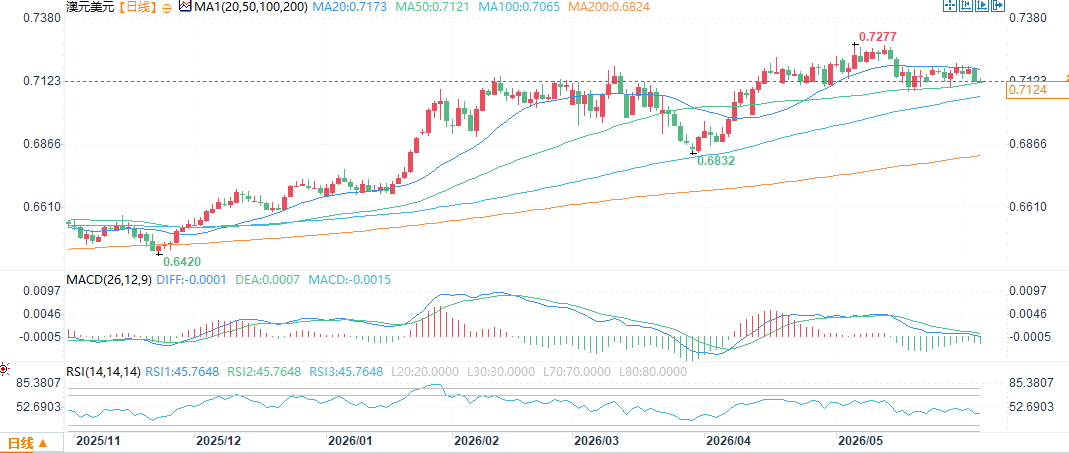
The daily chart shows that the Australian dollar against the US dollar is in a well-maintained upward trend. The price is currently around 0.7125, close to the 50-day moving average (MA50) and under pressure below the 20-day moving average (MA20). The medium- and long-term moving averages continue to rise, providing support. After gradually rising from the lows, the price is oscillating in a high-level range of 0.7120-0.7277. A break above the previous high would indicate continued upward movement, while a break below the MA50 would likely lead to a pullback to the MA100.
(AUD/USD daily chart, source: FX678)
The MACD lines are converging near the zero line and slightly turning green, indicating a balance between bullish and bearish momentum awaiting a breakout. The RSI is in the neutral range of 45, with no overbought or oversold conditions, suggesting short-term range-bound trading. The overall market is consolidating within an upward trend, and trading should focus on identifying opportunities based on breakouts from the upper or lower limits of the trading range.
At 13:06 Beijing time on June 4, the Australian dollar was trading at 0.7127/28 against the US dollar.
- Risk Warning and Disclaimer
- The market involves risk, and trading may not be suitable for all investors. This article is for reference only and does not constitute personal investment advice, nor does it take into account certain users’ specific investment objectives, financial situation, or other needs. Any investment decisions made based on this information are at your own risk.