The ECB is raising interest rates, the Fed is holding rates steady, and the Bank of England is considering cutting rates?
2026-06-12 08:51:51
On Friday (June 12) during the Asian session, the British pound traded in a narrow range against the US dollar, currently trading around 1.3410.
The Bank of England has been facing increasing pressure recently. On June 11, local time, the European Central Bank announced that it would raise the three key interest rates in the Eurozone by 25 basis points each. This is the first interest rate hike by the ECB since July 2023, and the ECB has become the first major economy central bank to resume raising interest rates this year.
Inflationary pressures are also rising across the Atlantic. Data released by the U.S. Bureau of Labor Statistics on June 10 showed that, driven by a sharp rise in energy prices, the U.S. CPI rose 4.2% year-on-year in May, the highest level since April 2023, and the first time in three years that the U.S. inflation rate has returned to above 4%.
Following the data release, market expectations for a Fed rate hike eased slightly, but overall, the market remains in a fully priced-in state of "no rate hike yet, but already under pressure." Interest rate futures market bets on a rate hike this year have declined somewhat, but Goldman Sachs has raised its probability of a rate hike from 10% to 20%, and JPMorgan Chase has included a 2027 rate hike in its forecast benchmark.
Amidst a global wave of central bank tightening signals, Bank of England Governor Bailey can only wistfully imagine a parallel universe where he could continue cutting interest rates. However, the reality is that rate hikes are becoming increasingly frequent. How the Bank of England will respond to this situation is being closely watched by the market.
The upward pressure on inflation is gradually shifting from expectations to actual data. Japan's PPI rose to 6.3% in May, a multi-year high, reflecting the continued transmission of energy and raw material costs to the production side. The US CPI rose 4.2% year-on-year and 0.5% month-on-month in May, the largest increase since early 2023. Although the US CPI is not a policy target of the Federal Reserve, it clearly indicates the direction of inflation—price pressures are spreading from the energy sector to a wider range of areas.
The energy price index rose 3.9% in May, marking the third consecutive month of strong growth and contributing over 60% to the overall CPI increase for the month. The continued rise in energy prices is being passed on to end consumers through multiple channels, including transportation, manufacturing, and retail. There are already indications that some businesses are beginning to pass on costs to consumers, with airfares, logistics costs, and food prices all showing varying degrees of increase.
More worryingly, early signs of a wage-price spiral are already emerging. In May, the average hourly wage in the United States rose by 3.9% year-on-year, which, although lower than the CPI increase, is still steadily climbing.
Despite President Trump's promise two or three days ago to reach a peace agreement within two or three days, hostilities in the Middle East continue and have even intensified. Traffic in the Strait of Hormuz remains far below normal levels, and the risk of oil supply disruptions has not dissipated. Unless there is a fundamental improvement in the geopolitical situation, energy prices are unlikely to fall substantially, and inflationary pressures will persist.
Currently, both Brent crude and West Texas Intermediate crude are below $90 per barrel, a slight decline from their previous peaks. One reason for this pullback is the market's natural reaction to high oil prices – after prices climbed to high levels, some traders opted to take profits, while positive changes also occurred on the supply side.
The Americas are experiencing a production boom. Latest data shows that Brazilian crude oil production increased by 20% year-on-year, reaching a record high; production in Guyana and the United States also broke records in April; Canadian production is strong, and Venezuelan production is slowly recovering. This increased supply has alleviated market panic about supply shortages to some extent, providing a downward buffer for oil prices.
In addition, while pipeline traffic has increased and a small number of oil tankers still pass through the Strait of Hormuz, the average daily traffic volume is only about 10% of pre-war levels, far from normal. This means that about one-fifth of the world's crude oil transportation routes remain substantially blocked.
However, it must be clearly recognized that many of the factors currently suppressing oil prices are obviously temporary. The release of strategic petroleum reserves is limited; once inventories fall below the warning line, release capacity will be exhausted. The reduction in imports by major Asian countries reflects more of a temporary weakness in demand than a structural change. Japanese Prime Minister Sanae Takaichi stated that Japan has secured crude oil equivalent to 100% of its expected monthly consumption in July, without needing to pass through the Strait of Hormuz. While this statement is encouraging, it also suggests that other countries may still be under pressure from supply disruptions.
Therefore, oil prices still face the risk of rising again. If the geopolitical situation deteriorates further, or if existing supply replenishment channels are unexpectedly disrupted, the market will face renewed upward pressure. Investors need to closely monitor the developments in the Middle East and the rate of global inventory depletion—these two variables will determine the ultimate direction of oil prices in the coming weeks.
There's also good news in the fertilizer sector: prices have peaked, and global food production cost pressures are easing. Urea prices in the US Gulf Coast have fallen back to pre-war levels, around $470 per ton, a drop of about 33% from the mid-April peak of $710 per ton. This decline is not only significant but also faster than many market participants expected. Urea prices in Latin America and Europe have also fallen sharply by 30% to 40%, and although they are still slightly above pre-war levels, a downward trend has been established.
Latest news this morning indicates that the decline in nitrogen fertilizer prices has spread to Asia, one of the most positive signs in this round of price drops. The latest urea tender in India received an average bid of $530 per ton, a decrease of approximately 44% from $947 in April. As one of the world's largest urea importers, India's purchase prices are often seen as a bellwether for the regional and even global nitrogen fertilizer market. This significant price reduction suggests that more supply is indeed returning to the market, and the tight supply-demand situation in Asia is clearly improving.
Analysts point out that the decline in fertilizer prices is mainly driven by three factors: first, although the situation in the Middle East has not completely subsided, its actual impact on fertilizer transportation has weakened; second, fertilizer exports from Russia and Belarus have gradually recovered, filling some of the supply gap; and third, previously high prices suppressed some demand, leading farmers to reduce their purchases and forcing suppliers to lower prices. However, considering that energy prices remain high and geopolitical risks have not completely dissipated, the room for further significant declines in fertilizer prices may be limited, and a consolidation pattern is more likely in the short term.
For the Governor of the Bank of England, house prices are a key area of focus. This month, both the National Building Institute and Halifax Bank released disappointing data. Data from the Royal Institution of Chartered Surveyors (RICS) showed that the net balance of new buyer inquiries in May was -34%, unchanged from the previous month. While the institution attempted to offer a positive interpretation, the -34% figure itself speaks volumes. The net balance of completed sales was -37%, also indicating a sluggish market.
Regarding house prices, the overall net balance remained at -35% for the second consecutive month. Downward pressure on prices was more pronounced in Southeast England and East Anglia, while Northern Ireland continued to record robust growth. Short-term price expectations were even weaker, with respondents at a net balance of -45% anticipating a decline in house prices over the next three months.
In the rental market, tenant demand rose (net balance +14%), while landlord supply remained tight (-28%). Rent expectations rose to +36%, the highest level since May last year. The Tenant Rights Act came into effect in early May, raising market concerns that it might backfire. In any case, rents appear poised to add new pressure to inflation.
In summary, the Bank of England should raise interest rates. Its inflation record is particularly poor, and financial market movements are effectively forcing a rate hike – British taxpayers will bear these costs, which will be passed on to fixed-rate mortgages. The yield on 3-year UK government bonds is now 4.419%, up from 4.238% previously.
However, Governor Bailey appears to be opposed to this. A similar deadlock, where a 5-4 vote previously favored a rate cut, may reappear – only this time, the debate will focus on whether to prevent a rate hike.
The GBP/USD pair is currently in a sideways consolidation phase on the daily chart, with the battle between bulls and bears relatively balanced.
On the moving average system, the price fluctuated narrowly around the MA20 (1.3245), MA50 (1.3252), MA100 (1.3358), and MA200 (1.3342). The short-term moving averages were intertwined with the medium- and long-term moving averages, and there were no clear bullish or bearish signals, indicating that a trend had not yet formed.
The MACD indicator shows that the DIFF line (0.0043) and DEA line (0.0024) are close to the zero axis, the histogram has turned slightly red, and the momentum is slightly bullish, but overall it is still near the zero axis and has not formed an effective divergence trend. The momentum of both bulls and bears is not strong.
The RSI value is approximately 62.55, which is in the neutral to bullish range, indicating that the bulls have a slight advantage, but it has not yet entered an extremely overheated state. There is still room for upward movement in the short term, but the risk of a pullback after overbought conditions should be noted.
Support is seen around the previous low of 1.3159, while resistance levels are the recent highs of 1.3657 and 1.3867. The current price is hovering around 1.3410. A breakout above the moving average resistance with significant volume could open up upward potential; conversely, a break below key support could lead to continued weak consolidation.
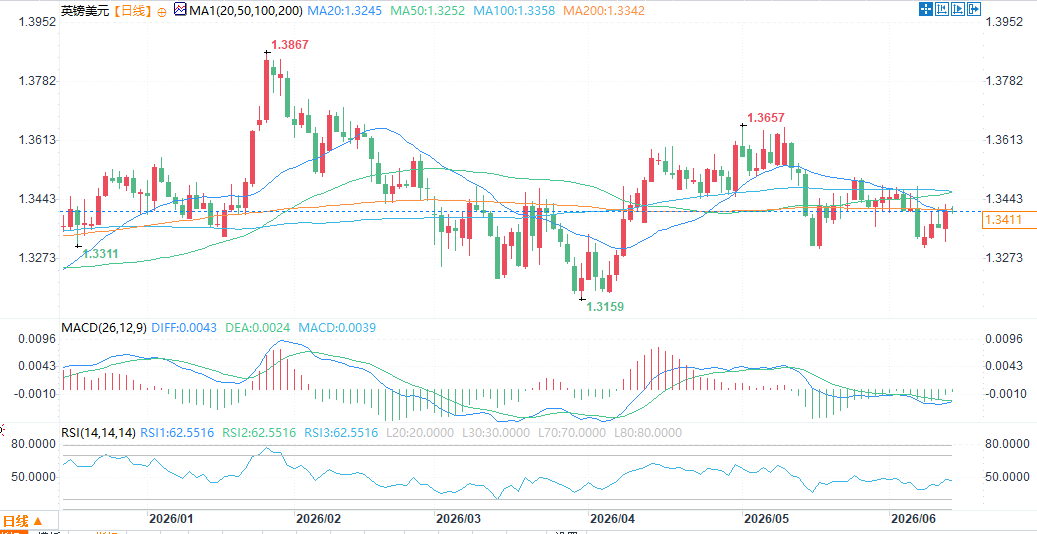
(GBP/USD daily chart, source: FX678)
At 8:51 AM Beijing time on June 12, the British pound was trading at 1.3407/08 against the US dollar.
The Bank of England has been facing increasing pressure recently. On June 11, local time, the European Central Bank announced that it would raise the three key interest rates in the Eurozone by 25 basis points each. This is the first interest rate hike by the ECB since July 2023, and the ECB has become the first major economy central bank to resume raising interest rates this year.
Inflationary pressures are also rising across the Atlantic. Data released by the U.S. Bureau of Labor Statistics on June 10 showed that, driven by a sharp rise in energy prices, the U.S. CPI rose 4.2% year-on-year in May, the highest level since April 2023, and the first time in three years that the U.S. inflation rate has returned to above 4%.
Following the data release, market expectations for a Fed rate hike eased slightly, but overall, the market remains in a fully priced-in state of "no rate hike yet, but already under pressure." Interest rate futures market bets on a rate hike this year have declined somewhat, but Goldman Sachs has raised its probability of a rate hike from 10% to 20%, and JPMorgan Chase has included a 2027 rate hike in its forecast benchmark.
Amidst a global wave of central bank tightening signals, Bank of England Governor Bailey can only wistfully imagine a parallel universe where he could continue cutting interest rates. However, the reality is that rate hikes are becoming increasingly frequent. How the Bank of England will respond to this situation is being closely watched by the market.
Inflation data is sounding alarm bells, with energy prices remaining the main driver.
The upward pressure on inflation is gradually shifting from expectations to actual data. Japan's PPI rose to 6.3% in May, a multi-year high, reflecting the continued transmission of energy and raw material costs to the production side. The US CPI rose 4.2% year-on-year and 0.5% month-on-month in May, the largest increase since early 2023. Although the US CPI is not a policy target of the Federal Reserve, it clearly indicates the direction of inflation—price pressures are spreading from the energy sector to a wider range of areas.
The energy price index rose 3.9% in May, marking the third consecutive month of strong growth and contributing over 60% to the overall CPI increase for the month. The continued rise in energy prices is being passed on to end consumers through multiple channels, including transportation, manufacturing, and retail. There are already indications that some businesses are beginning to pass on costs to consumers, with airfares, logistics costs, and food prices all showing varying degrees of increase.
More worryingly, early signs of a wage-price spiral are already emerging. In May, the average hourly wage in the United States rose by 3.9% year-on-year, which, although lower than the CPI increase, is still steadily climbing.
Despite President Trump's promise two or three days ago to reach a peace agreement within two or three days, hostilities in the Middle East continue and have even intensified. Traffic in the Strait of Hormuz remains far below normal levels, and the risk of oil supply disruptions has not dissipated. Unless there is a fundamental improvement in the geopolitical situation, energy prices are unlikely to fall substantially, and inflationary pressures will persist.
Crude oil prices: Suppressed by multiple factors, but upside risks remain.
Currently, both Brent crude and West Texas Intermediate crude are below $90 per barrel, a slight decline from their previous peaks. One reason for this pullback is the market's natural reaction to high oil prices – after prices climbed to high levels, some traders opted to take profits, while positive changes also occurred on the supply side.
The Americas are experiencing a production boom. Latest data shows that Brazilian crude oil production increased by 20% year-on-year, reaching a record high; production in Guyana and the United States also broke records in April; Canadian production is strong, and Venezuelan production is slowly recovering. This increased supply has alleviated market panic about supply shortages to some extent, providing a downward buffer for oil prices.
In addition, while pipeline traffic has increased and a small number of oil tankers still pass through the Strait of Hormuz, the average daily traffic volume is only about 10% of pre-war levels, far from normal. This means that about one-fifth of the world's crude oil transportation routes remain substantially blocked.
However, it must be clearly recognized that many of the factors currently suppressing oil prices are obviously temporary. The release of strategic petroleum reserves is limited; once inventories fall below the warning line, release capacity will be exhausted. The reduction in imports by major Asian countries reflects more of a temporary weakness in demand than a structural change. Japanese Prime Minister Sanae Takaichi stated that Japan has secured crude oil equivalent to 100% of its expected monthly consumption in July, without needing to pass through the Strait of Hormuz. While this statement is encouraging, it also suggests that other countries may still be under pressure from supply disruptions.
Therefore, oil prices still face the risk of rising again. If the geopolitical situation deteriorates further, or if existing supply replenishment channels are unexpectedly disrupted, the market will face renewed upward pressure. Investors need to closely monitor the developments in the Middle East and the rate of global inventory depletion—these two variables will determine the ultimate direction of oil prices in the coming weeks.
Fertilizer prices: Pressure has eased temporarily, and prices in Asia have also begun to decline.
There's also good news in the fertilizer sector: prices have peaked, and global food production cost pressures are easing. Urea prices in the US Gulf Coast have fallen back to pre-war levels, around $470 per ton, a drop of about 33% from the mid-April peak of $710 per ton. This decline is not only significant but also faster than many market participants expected. Urea prices in Latin America and Europe have also fallen sharply by 30% to 40%, and although they are still slightly above pre-war levels, a downward trend has been established.
Latest news this morning indicates that the decline in nitrogen fertilizer prices has spread to Asia, one of the most positive signs in this round of price drops. The latest urea tender in India received an average bid of $530 per ton, a decrease of approximately 44% from $947 in April. As one of the world's largest urea importers, India's purchase prices are often seen as a bellwether for the regional and even global nitrogen fertilizer market. This significant price reduction suggests that more supply is indeed returning to the market, and the tight supply-demand situation in Asia is clearly improving.
Analysts point out that the decline in fertilizer prices is mainly driven by three factors: first, although the situation in the Middle East has not completely subsided, its actual impact on fertilizer transportation has weakened; second, fertilizer exports from Russia and Belarus have gradually recovered, filling some of the supply gap; and third, previously high prices suppressed some demand, leading farmers to reduce their purchases and forcing suppliers to lower prices. However, considering that energy prices remain high and geopolitical risks have not completely dissipated, the room for further significant declines in fertilizer prices may be limited, and a consolidation pattern is more likely in the short term.
UK Housing Market: Weak Demand Pressures Prices, Rising Rents Pose Potential Risks
For the Governor of the Bank of England, house prices are a key area of focus. This month, both the National Building Institute and Halifax Bank released disappointing data. Data from the Royal Institution of Chartered Surveyors (RICS) showed that the net balance of new buyer inquiries in May was -34%, unchanged from the previous month. While the institution attempted to offer a positive interpretation, the -34% figure itself speaks volumes. The net balance of completed sales was -37%, also indicating a sluggish market.
Regarding house prices, the overall net balance remained at -35% for the second consecutive month. Downward pressure on prices was more pronounced in Southeast England and East Anglia, while Northern Ireland continued to record robust growth. Short-term price expectations were even weaker, with respondents at a net balance of -45% anticipating a decline in house prices over the next three months.
In the rental market, tenant demand rose (net balance +14%), while landlord supply remained tight (-28%). Rent expectations rose to +36%, the highest level since May last year. The Tenant Rights Act came into effect in early May, raising market concerns that it might backfire. In any case, rents appear poised to add new pressure to inflation.
Market Pricing and Real-World Pressures: Interest Rate Hikes May Be Inevitable
In summary, the Bank of England should raise interest rates. Its inflation record is particularly poor, and financial market movements are effectively forcing a rate hike – British taxpayers will bear these costs, which will be passed on to fixed-rate mortgages. The yield on 3-year UK government bonds is now 4.419%, up from 4.238% previously.
However, Governor Bailey appears to be opposed to this. A similar deadlock, where a 5-4 vote previously favored a rate cut, may reappear – only this time, the debate will focus on whether to prevent a rate hike.
GBP/USD Technical Analysis
The GBP/USD pair is currently in a sideways consolidation phase on the daily chart, with the battle between bulls and bears relatively balanced.
On the moving average system, the price fluctuated narrowly around the MA20 (1.3245), MA50 (1.3252), MA100 (1.3358), and MA200 (1.3342). The short-term moving averages were intertwined with the medium- and long-term moving averages, and there were no clear bullish or bearish signals, indicating that a trend had not yet formed.
The MACD indicator shows that the DIFF line (0.0043) and DEA line (0.0024) are close to the zero axis, the histogram has turned slightly red, and the momentum is slightly bullish, but overall it is still near the zero axis and has not formed an effective divergence trend. The momentum of both bulls and bears is not strong.
The RSI value is approximately 62.55, which is in the neutral to bullish range, indicating that the bulls have a slight advantage, but it has not yet entered an extremely overheated state. There is still room for upward movement in the short term, but the risk of a pullback after overbought conditions should be noted.
Support is seen around the previous low of 1.3159, while resistance levels are the recent highs of 1.3657 and 1.3867. The current price is hovering around 1.3410. A breakout above the moving average resistance with significant volume could open up upward potential; conversely, a break below key support could lead to continued weak consolidation.
(GBP/USD daily chart, source: FX678)
At 8:51 AM Beijing time on June 12, the British pound was trading at 1.3407/08 against the US dollar.
- Risk Warning and Disclaimer
- The market involves risk, and trading may not be suitable for all investors. This article is for reference only and does not constitute personal investment advice, nor does it take into account certain users’ specific investment objectives, financial situation, or other needs. Any investment decisions made based on this information are at your own risk.