US CPI returned to 4% in May, while PPI surged to 6.5%, potentially leading to a second consecutive week of weakness for gold.
2026-06-12 14:05:34
On Friday (June 12) during the Asian session, spot gold rose and then fell back, encountering a new round of selling. The current price is trading around $4,182 per ounce.
Uncertainty surrounding the US-Iran peace agreement boosted demand for the US dollar, and coupled with hawkish expectations from the Federal Reserve, put downward pressure on non-yielding gold. Gold prices are still on track for a second consecutive week of significant declines.
The US and Iran continue to send conflicting messages regarding a potential peace agreement. Trump stated on Thursday that an agreement had been reached with Iran, and the final document could be signed soon, possibly even by the weekend.
However, this optimism quickly faded – Iran countered that a final decision on the agreement had not yet been reached.
Reports indicate that Iran's new Supreme Leader Ayatollah Khamenei has not agreed to the peace proposal put forward by the United States.
The Iranian Foreign Ministry reportedly stated that key issues, including the right of passage through the Strait of Hormuz and frozen funds, remain unresolved.
Significant differences remain between the two sides on core issues, greatly reducing the likelihood of a substantive agreement in the short term. Market optimism regarding the prospects for peace has cooled rapidly, and risk aversion has resurfaced.
Meanwhile, Iranian forces intercepted an uncoordinated oil tanker attempting to pass through the strategic waterway, highlighting the uncertainty surrounding Iran's stance. The US military intercepted and shot down two Iranian one-way attack drones near the Strait of Hormuz. These military skirmishes demonstrate that even amidst ongoing diplomatic negotiations, both sides maintain a high degree of vigilance and confrontation on the ground.
Recent developments have allowed geopolitical risk premiums to continue to play a role, driving a modest recovery in crude oil prices and further exacerbating inflation concerns.
Brent crude oil rebounded to above $89 in early Asian trading, demonstrating that any misstep could trigger a sharp market reaction.
For gold, the ongoing geopolitical tensions have provided a floor, but the strong performance of the US dollar is still suppressing the upside potential of gold prices in the short term.
This week's US CPI and PPI data show that inflation is accelerating again. The CPI rose 4.2% year-on-year in May, the highest level since April 2023; the PPI rose 6.5% year-on-year, recording its largest increase in three and a half years.
These two sets of data shattered previous optimistic expectations of a continued decline in inflation and reinforced market expectations that the Federal Reserve will raise interest rates before the end of the year.
The CME Group's FedWatch Tool shows that the market's probability of a 25 basis point rate hike in December has risen to 43% from about 14% a month ago. This is positive for the dollar—the dollar index rose after the data release, holding above 99.90, while putting downward pressure on non-yielding gold.
However, traders may not build large bearish positions in gold for the time being, and instead choose to wait and see how the Middle East crisis develops.
Currently, the signals sent by the US and Iran regarding a peace agreement are contradictory, and geopolitical risks have not dissipated. Any escalation of the situation could trigger a return of safe-haven funds to gold, leading to a squeeze on short sellers.
Amid this uncertainty, some investors may choose to reduce their holdings or remain on the sidelines.
Nevertheless, from a technical and capital flow perspective, gold is still likely to record a sharp decline for the second consecutive week.
In a recent report, Citi maintained its short-term bearish stance on gold and lowered its 0-3 month target price from $4,300 to $4,000.
The bank noted that, influenced by strong US employment data, gold has closed below its 200-day moving average for the first time since September 2023.
Citigroup's pessimistic assessment is based on four main reasons: First, the macroeconomic backdrop has shifted, with stabilizing real yields and a stronger dollar altering market expectations for aggressive interest rate cuts by the Federal Reserve; second, physical gold purchases are insufficient to support current prices—maintaining current gold prices requires an annual purchase pace of approximately $900 billion, while normal purchase volumes from 2010 to 2024 are only $250-400 billion; third, if the Strait of Hormuz remains closed, gold purchases could drop to $700-750 billion, potentially causing gold prices to mechanically fall back to around $3,500; and fourth, the safe-haven premium has peaked. However, the bank maintains its 6-12 month target price of $5,000 and remains bullish on gold in the long term.
Citigroup explicitly warned: "The short-term risk for gold is skewed to the downside, and buying on dips at this time is only suitable for investors who strongly believe that the situation will not escalate further."
JPMorgan Chase lowered its 2026 average gold price forecast to $5,243 per ounce from $5,708 per ounce, but still expects gold prices to reach $6,000 per ounce by the end of the year.
The bank pointed out that the weak short-term demand for gold is reflected in the stagnation of trading activity and demand indicators – the total open interest and trading volume of COMEX gold futures remain low, the net open interest of managed funds in futures is hovering at a low level, and ETF inflows are also relatively weak.
However, JPMorgan is optimistic about a demand rebound in the second half of the year, believing that funds may flow back into the gold market as inflationary pressures gradually ease and the Fed's policy path becomes clearer. Its year-end target price of $6,000 is among the more optimistic of major investment banks.
The daily chart for spot gold is generally bearish, with prices retreating from their highs and currently in a downtrend. Prices have broken below the 20-day, 50-day, 100-day, and 200-day moving averages (MA20, MA50, MA100, and MA200), and the moving average system shows a clear bearish alignment, indicating significant downward pressure in the short term. The previous low around 4099 and the recent low around 4023 form key support levels, while the 200-day moving average (MA200) acts as a significant resistance level.
In terms of indicators, the MACD indicator shows both the DIFF and DEA lines running below the zero axis, and the MACD histogram continues to expand, indicating that bearish momentum is still being released. The RSI indicator is at 34.60, approaching the oversold zone, but there are no clear signs of stabilization yet, and the downward momentum has not completely exhausted.
In summary, spot gold is currently in a clear downtrend, with the bearish trend dominating the market. A short-term technical rebound is possible, but its extent is expected to be limited due to strong resistance from moving averages above.
In terms of trading strategy, a bearish approach is recommended, with a focus on the effectiveness of key support levels below. If the support level is breached, the downside potential will open up further.
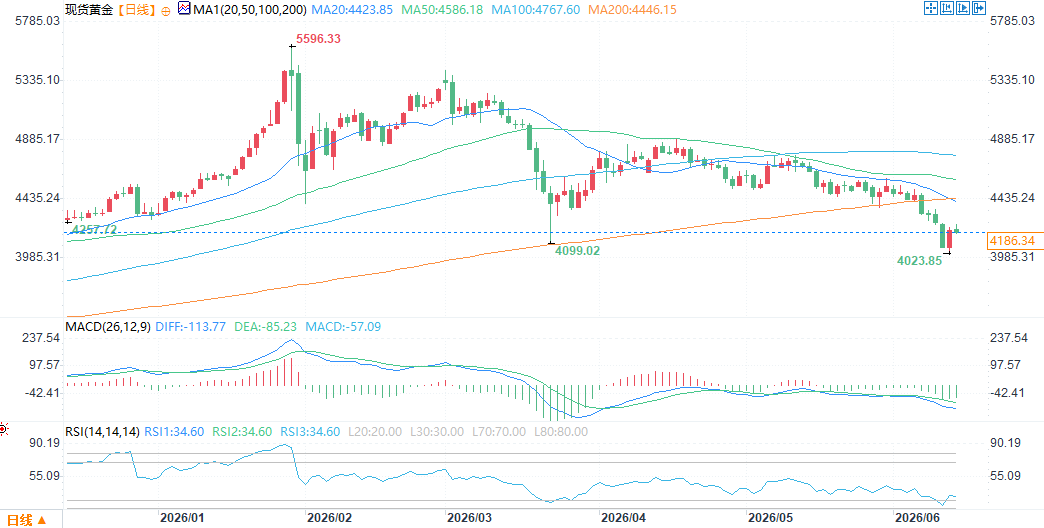
(Spot gold daily chart, source: FX678)
Overall, gold is currently facing multiple pressures: the outlook for a US-Iran agreement remains uncertain, but the dollar is supported by safe-haven demand; renewed US inflation reinforces hawkish expectations from the Federal Reserve; and technical indicators show significant resistance from moving averages. While geopolitical risks have provided some support for gold prices, they are insufficient to reverse the short-term weakness. Traders are currently in a wait-and-see mode, awaiting further clarity on the Middle East crisis.
At 14:05 Beijing time on June 12, spot gold was trading at $4181.60 per ounce.
Uncertainty surrounding the US-Iran peace agreement boosted demand for the US dollar, and coupled with hawkish expectations from the Federal Reserve, put downward pressure on non-yielding gold. Gold prices are still on track for a second consecutive week of significant declines.
Repeated signals of peace between the US and Iran persist, and geopolitical risk premiums remain.
The US and Iran continue to send conflicting messages regarding a potential peace agreement. Trump stated on Thursday that an agreement had been reached with Iran, and the final document could be signed soon, possibly even by the weekend.
However, this optimism quickly faded – Iran countered that a final decision on the agreement had not yet been reached.
Reports indicate that Iran's new Supreme Leader Ayatollah Khamenei has not agreed to the peace proposal put forward by the United States.
The Iranian Foreign Ministry reportedly stated that key issues, including the right of passage through the Strait of Hormuz and frozen funds, remain unresolved.
Significant differences remain between the two sides on core issues, greatly reducing the likelihood of a substantive agreement in the short term. Market optimism regarding the prospects for peace has cooled rapidly, and risk aversion has resurfaced.
Meanwhile, Iranian forces intercepted an uncoordinated oil tanker attempting to pass through the strategic waterway, highlighting the uncertainty surrounding Iran's stance. The US military intercepted and shot down two Iranian one-way attack drones near the Strait of Hormuz. These military skirmishes demonstrate that even amidst ongoing diplomatic negotiations, both sides maintain a high degree of vigilance and confrontation on the ground.
Recent developments have allowed geopolitical risk premiums to continue to play a role, driving a modest recovery in crude oil prices and further exacerbating inflation concerns.
Brent crude oil rebounded to above $89 in early Asian trading, demonstrating that any misstep could trigger a sharp market reaction.
For gold, the ongoing geopolitical tensions have provided a floor, but the strong performance of the US dollar is still suppressing the upside potential of gold prices in the short term.
US inflation reignites, hawkish expectations from the Federal Reserve support the dollar.
This week's US CPI and PPI data show that inflation is accelerating again. The CPI rose 4.2% year-on-year in May, the highest level since April 2023; the PPI rose 6.5% year-on-year, recording its largest increase in three and a half years.
These two sets of data shattered previous optimistic expectations of a continued decline in inflation and reinforced market expectations that the Federal Reserve will raise interest rates before the end of the year.
The CME Group's FedWatch Tool shows that the market's probability of a 25 basis point rate hike in December has risen to 43% from about 14% a month ago. This is positive for the dollar—the dollar index rose after the data release, holding above 99.90, while putting downward pressure on non-yielding gold.
However, traders may not build large bearish positions in gold for the time being, and instead choose to wait and see how the Middle East crisis develops.
Currently, the signals sent by the US and Iran regarding a peace agreement are contradictory, and geopolitical risks have not dissipated. Any escalation of the situation could trigger a return of safe-haven funds to gold, leading to a squeeze on short sellers.
Amid this uncertainty, some investors may choose to reduce their holdings or remain on the sidelines.
Nevertheless, from a technical and capital flow perspective, gold is still likely to record a sharp decline for the second consecutive week.
Institutional Views
In a recent report, Citi maintained its short-term bearish stance on gold and lowered its 0-3 month target price from $4,300 to $4,000.
The bank noted that, influenced by strong US employment data, gold has closed below its 200-day moving average for the first time since September 2023.
Citigroup's pessimistic assessment is based on four main reasons: First, the macroeconomic backdrop has shifted, with stabilizing real yields and a stronger dollar altering market expectations for aggressive interest rate cuts by the Federal Reserve; second, physical gold purchases are insufficient to support current prices—maintaining current gold prices requires an annual purchase pace of approximately $900 billion, while normal purchase volumes from 2010 to 2024 are only $250-400 billion; third, if the Strait of Hormuz remains closed, gold purchases could drop to $700-750 billion, potentially causing gold prices to mechanically fall back to around $3,500; and fourth, the safe-haven premium has peaked. However, the bank maintains its 6-12 month target price of $5,000 and remains bullish on gold in the long term.
Citigroup explicitly warned: "The short-term risk for gold is skewed to the downside, and buying on dips at this time is only suitable for investors who strongly believe that the situation will not escalate further."
JPMorgan Chase lowered its 2026 average gold price forecast to $5,243 per ounce from $5,708 per ounce, but still expects gold prices to reach $6,000 per ounce by the end of the year.
The bank pointed out that the weak short-term demand for gold is reflected in the stagnation of trading activity and demand indicators – the total open interest and trading volume of COMEX gold futures remain low, the net open interest of managed funds in futures is hovering at a low level, and ETF inflows are also relatively weak.
However, JPMorgan is optimistic about a demand rebound in the second half of the year, believing that funds may flow back into the gold market as inflationary pressures gradually ease and the Fed's policy path becomes clearer. Its year-end target price of $6,000 is among the more optimistic of major investment banks.
Technical Analysis
The daily chart for spot gold is generally bearish, with prices retreating from their highs and currently in a downtrend. Prices have broken below the 20-day, 50-day, 100-day, and 200-day moving averages (MA20, MA50, MA100, and MA200), and the moving average system shows a clear bearish alignment, indicating significant downward pressure in the short term. The previous low around 4099 and the recent low around 4023 form key support levels, while the 200-day moving average (MA200) acts as a significant resistance level.
In terms of indicators, the MACD indicator shows both the DIFF and DEA lines running below the zero axis, and the MACD histogram continues to expand, indicating that bearish momentum is still being released. The RSI indicator is at 34.60, approaching the oversold zone, but there are no clear signs of stabilization yet, and the downward momentum has not completely exhausted.
In summary, spot gold is currently in a clear downtrend, with the bearish trend dominating the market. A short-term technical rebound is possible, but its extent is expected to be limited due to strong resistance from moving averages above.
In terms of trading strategy, a bearish approach is recommended, with a focus on the effectiveness of key support levels below. If the support level is breached, the downside potential will open up further.
(Spot gold daily chart, source: FX678)
Conclusion: Short-term bearish; awaiting clarification of the geopolitical situation.
Overall, gold is currently facing multiple pressures: the outlook for a US-Iran agreement remains uncertain, but the dollar is supported by safe-haven demand; renewed US inflation reinforces hawkish expectations from the Federal Reserve; and technical indicators show significant resistance from moving averages. While geopolitical risks have provided some support for gold prices, they are insufficient to reverse the short-term weakness. Traders are currently in a wait-and-see mode, awaiting further clarity on the Middle East crisis.
At 14:05 Beijing time on June 12, spot gold was trading at $4181.60 per ounce.
- Risk Warning and Disclaimer
- The market involves risk, and trading may not be suitable for all investors. This article is for reference only and does not constitute personal investment advice, nor does it take into account certain users’ specific investment objectives, financial situation, or other needs. Any investment decisions made based on this information are at your own risk.