Easing tensions in the Middle East suppressed safe-haven demand, and gold prices remained range-bound.
2026-06-29 13:26:24
Gold prices came under slight pressure during Monday's Asian trading session, falling back to around $4,060 per ounce , continuing the technical correction after previous high-level consolidation. This adjustment was mainly due to two combined factors: a short-term decline in geopolitical risk premiums and the continued pressure on non-yielding assets from expectations of Federal Reserve policy.

From a geopolitical perspective, the United States and Iran have agreed to suspend recent military confrontations in the Gulf region and plan to hold a new round of talks in Qatar. In the preceding days, the conflict between the two sides over the Strait of Hormuz escalated, leading to a significant increase in market concerns about global oil transport security and inflation prospects, which initially drove gold prices up rapidly. However, as the two sides entered a negotiation window, market risk aversion cooled somewhat, and some funds flowed out of safe-haven assets, putting short-term pressure on gold prices.
However, the market remains cautious in its assessment of the situation. Iran has emphasized that it still leads the passage arrangements in the Strait of Hormuz and warned that any deviation from the established route could trigger new tensions. This means that the current so-called "de-escalation" is more of a temporary easing than a structural solution, and geopolitical risks remain highly recurrent.
At the macroeconomic policy level, the Federal Reserve's interest rate path remains a significant factor suppressing gold prices. Market expectations for future interest rate hikes have increased, with market surveys showing traders currently pricing in a nearly 59.7% probability of a September rate hike, reflecting market concerns about sticky inflation and a prolonged policy tightening cycle.
Logically, a renewed escalation of geopolitical conflicts could push up energy prices and strengthen inflation expectations, further supporting expectations of interest rate hikes. This transmission chain of "inflation → interest rate hike → suppression of gold" creates a complex game structure for gold between safe-haven demand and interest rate pressures. The key data the market is currently focused on is the US non-farm payrolls (NFP) report to be released this Thursday. The market expects approximately 114,000 new jobs to be added in June, with the unemployment rate remaining around 4.3% . This data will directly affect the market's repricing of the Fed's policy path. If the employment data is stronger than expected, it could strengthen hawkish expectations and further suppress gold prices; conversely, if the data is weak, it could provide new upward momentum for gold.
Overall, gold is currently in a typical dual structure of "receding high risk premium + suppressed interest rate expectations," with short-term fluctuations relying more on alternating drivers of geopolitical news and US macroeconomic data.
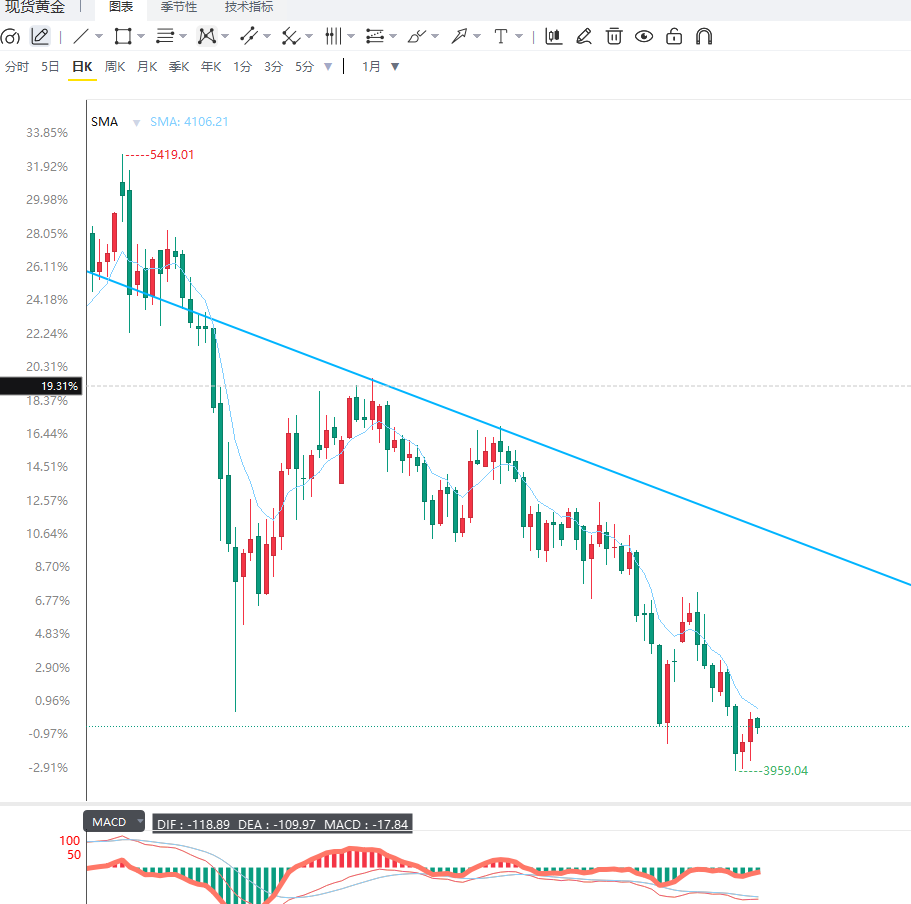
From a daily chart perspective, gold has entered a clear high-level consolidation phase after its previous sustained surge, maintaining a wide range of consolidation above $4,000 . While the overall trend has not yet shown a clear reversal signal, upward momentum has clearly weakened, and the market is entering a period of high-level digestion. Key resistance lies in the $4,100-$4,150 area , a zone of dense trading volume from previous rallies that has repeatedly acted as resistance. A successful breakout above this range could reopen upward potential; conversely, continued resistance could lead to further downward testing of support levels.
On the downside support level, the first thing to watch is the psychological and technical support level of $4,000 . If this level is broken, the next support zone may shift down to the $3,920-$3,880 range , which was the platform where the previous upward movement started.
From a 4-hour chart perspective, gold prices have entered a pullback phase after reaching a high. The short-term moving average system is flattening and showing slight signs of turning upwards, indicating that upward momentum is gradually weakening. Momentum indicators are in neutral to weak territory, suggesting the market is entering a consolidation phase rather than a trend reversal. If prices can stabilize above $4000, a sideways rebound structure is still possible; however, if prices break below this level, the short-term pullback could extend further.
Editor's Summary <br/>Overall, the current pullback in gold prices is mainly driven by a temporary decline in geopolitical risk premiums and hawkish expectations from the Federal Reserve. The entry of the US and Iran into negotiation phases has reduced short-term safe-haven demand, but the situation in the Middle East remains fundamentally unstable, providing potential support for gold. From a medium-term perspective, gold remains in a complex environment of "high-level consolidation + policy expectation dominance," with no clear trend direction. In the short term, the effectiveness of the $4,000 support level and the performance of US non-farm payroll data will be key factors determining the next direction of gold prices.
From a geopolitical perspective, the United States and Iran have agreed to suspend recent military confrontations in the Gulf region and plan to hold a new round of talks in Qatar. In the preceding days, the conflict between the two sides over the Strait of Hormuz escalated, leading to a significant increase in market concerns about global oil transport security and inflation prospects, which initially drove gold prices up rapidly. However, as the two sides entered a negotiation window, market risk aversion cooled somewhat, and some funds flowed out of safe-haven assets, putting short-term pressure on gold prices.
However, the market remains cautious in its assessment of the situation. Iran has emphasized that it still leads the passage arrangements in the Strait of Hormuz and warned that any deviation from the established route could trigger new tensions. This means that the current so-called "de-escalation" is more of a temporary easing than a structural solution, and geopolitical risks remain highly recurrent.
At the macroeconomic policy level, the Federal Reserve's interest rate path remains a significant factor suppressing gold prices. Market expectations for future interest rate hikes have increased, with market surveys showing traders currently pricing in a nearly 59.7% probability of a September rate hike, reflecting market concerns about sticky inflation and a prolonged policy tightening cycle.
Logically, a renewed escalation of geopolitical conflicts could push up energy prices and strengthen inflation expectations, further supporting expectations of interest rate hikes. This transmission chain of "inflation → interest rate hike → suppression of gold" creates a complex game structure for gold between safe-haven demand and interest rate pressures. The key data the market is currently focused on is the US non-farm payrolls (NFP) report to be released this Thursday. The market expects approximately 114,000 new jobs to be added in June, with the unemployment rate remaining around 4.3% . This data will directly affect the market's repricing of the Fed's policy path. If the employment data is stronger than expected, it could strengthen hawkish expectations and further suppress gold prices; conversely, if the data is weak, it could provide new upward momentum for gold.
Overall, gold is currently in a typical dual structure of "receding high risk premium + suppressed interest rate expectations," with short-term fluctuations relying more on alternating drivers of geopolitical news and US macroeconomic data.
From a daily chart perspective, gold has entered a clear high-level consolidation phase after its previous sustained surge, maintaining a wide range of consolidation above $4,000 . While the overall trend has not yet shown a clear reversal signal, upward momentum has clearly weakened, and the market is entering a period of high-level digestion. Key resistance lies in the $4,100-$4,150 area , a zone of dense trading volume from previous rallies that has repeatedly acted as resistance. A successful breakout above this range could reopen upward potential; conversely, continued resistance could lead to further downward testing of support levels.
On the downside support level, the first thing to watch is the psychological and technical support level of $4,000 . If this level is broken, the next support zone may shift down to the $3,920-$3,880 range , which was the platform where the previous upward movement started.
From a 4-hour chart perspective, gold prices have entered a pullback phase after reaching a high. The short-term moving average system is flattening and showing slight signs of turning upwards, indicating that upward momentum is gradually weakening. Momentum indicators are in neutral to weak territory, suggesting the market is entering a consolidation phase rather than a trend reversal. If prices can stabilize above $4000, a sideways rebound structure is still possible; however, if prices break below this level, the short-term pullback could extend further.
Editor's Summary <br/>Overall, the current pullback in gold prices is mainly driven by a temporary decline in geopolitical risk premiums and hawkish expectations from the Federal Reserve. The entry of the US and Iran into negotiation phases has reduced short-term safe-haven demand, but the situation in the Middle East remains fundamentally unstable, providing potential support for gold. From a medium-term perspective, gold remains in a complex environment of "high-level consolidation + policy expectation dominance," with no clear trend direction. In the short term, the effectiveness of the $4,000 support level and the performance of US non-farm payroll data will be key factors determining the next direction of gold prices.
- Risk Warning and Disclaimer
- The market involves risk, and trading may not be suitable for all investors. This article is for reference only and does not constitute personal investment advice, nor does it take into account certain users’ specific investment objectives, financial situation, or other needs. Any investment decisions made based on this information are at your own risk.