Morgan Stanley lowered its forecast twice in two weeks; why did the bullish narrative on crude oil fail?
2026-06-30 14:58:51
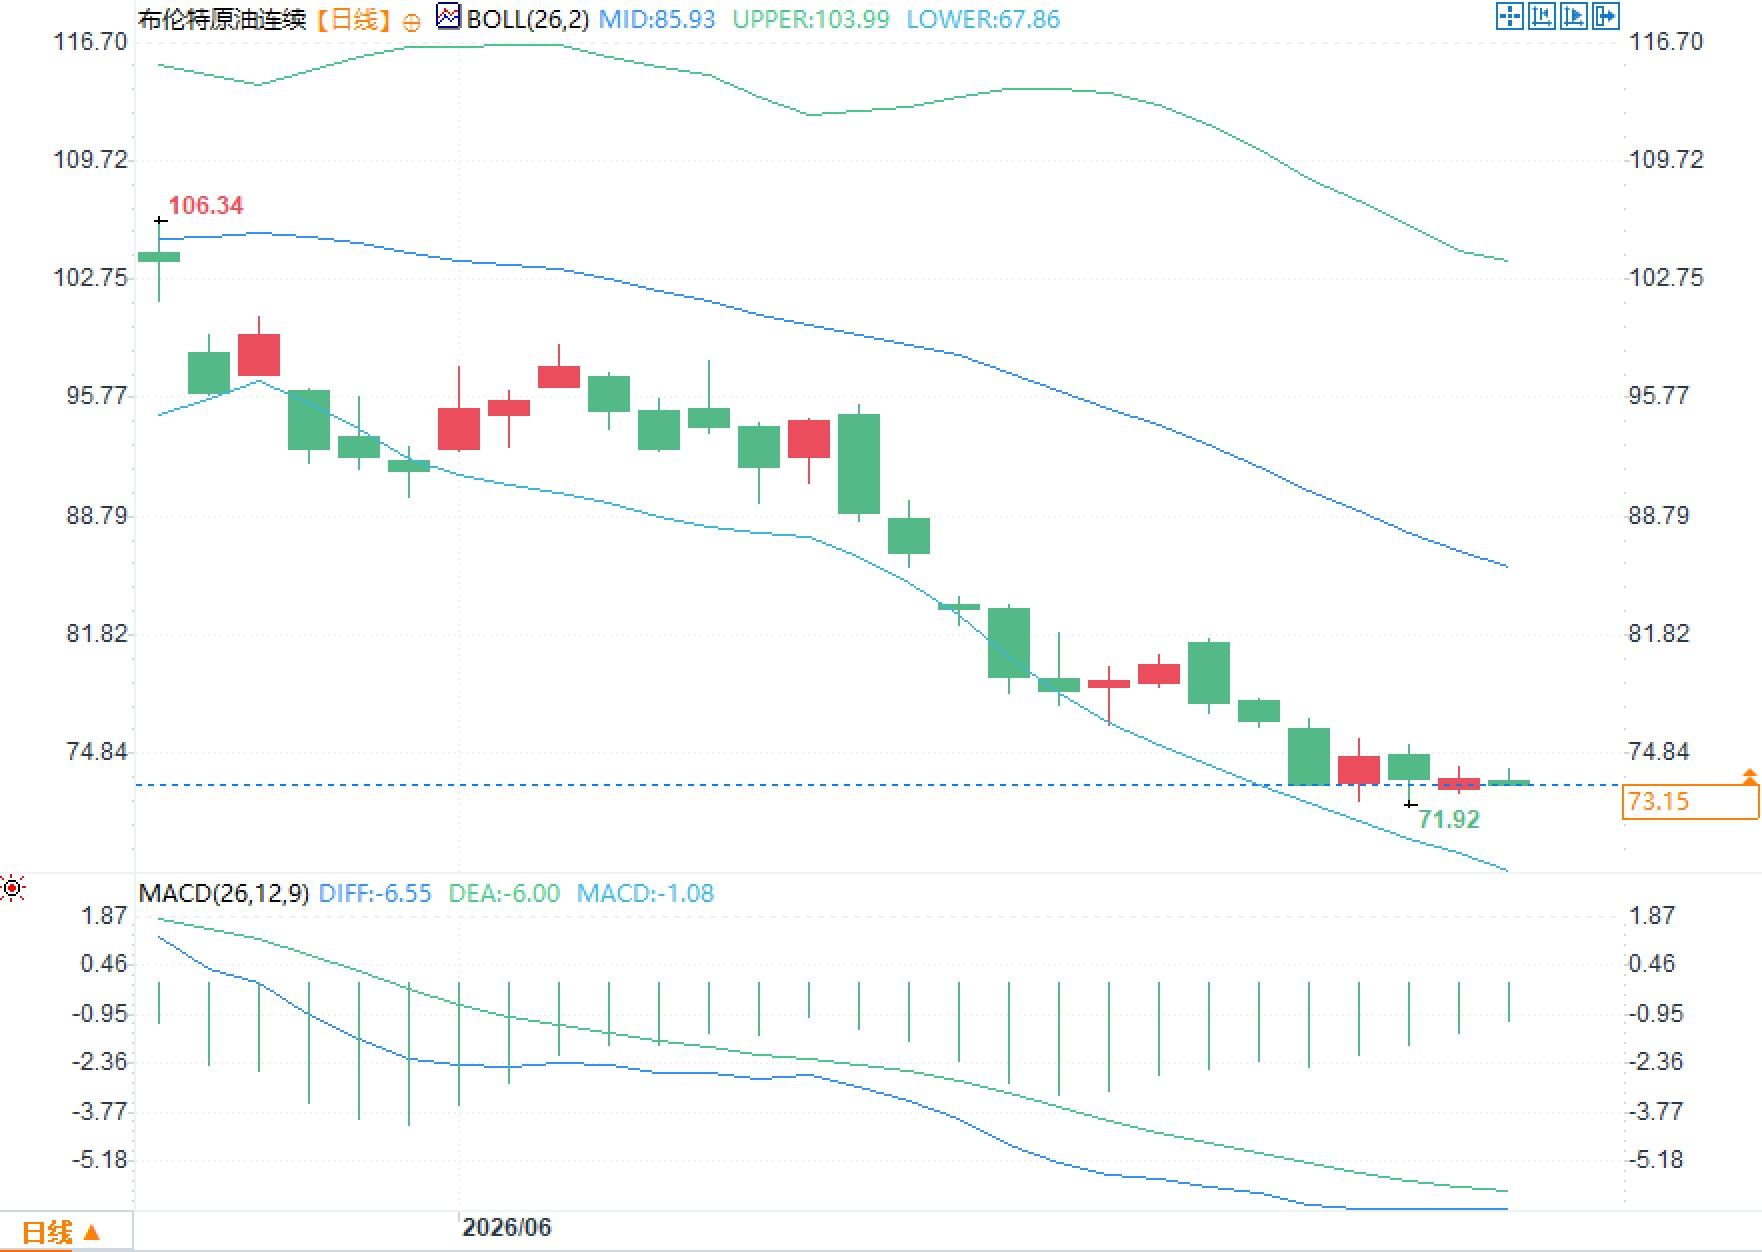
On Tuesday, June 30th, the main trading theme for Brent crude oil shifted from the "Strait closure risk premium" to "oversupply pricing after supply recovery." Currently, the Brent crude oil contract is trading at $73.15 per barrel, down approximately 0.5% on the day. The daily chart shows the price is close to the lower Bollinger Band, with the middle band around $85.93, the upper band at $103.99, and the lower band at $67.86. The MACD remains in negative territory, indicating that the medium-term downward channel pattern remains unchanged.

Morgan Stanley lowered its oil price forecast for the second time in about two weeks, citing changes in key assumptions: a faster-than-expected recovery of traffic in the Strait of Hormuz and a reduced extreme tail risk of disruptions to Gulf exports. The bank lowered its Q3 and Q4 Dated Brent average price forecast to $75 per barrel and its year-end 2027 forecast to $70 per barrel. This is not simply a price correction, but rather a removal of the "supply unavailability premium" previously embedded in the price.
More importantly, the pullback in oil prices from above $126 a barrel in April to around $73 indicates that the market is no longer pricing in the worst-case scenario. If the supply curve recovers to about 65% of its pre-conflict level, it could cover approximately 11 to 12 million barrels per day of demand, and the supply panic would quickly translate into a reassessment of inventories, refinery margins, and forward curves.
The current oil market is not without supply risks, but the risk structure has changed. The International Energy Agency's June report projects that global oil demand will decline by 1.1 million barrels per day year-on-year in 2026, with global supply falling to 102.4 million barrels per day. However, supply may rebound by 8 million barrels per day to 110.3 million barrels per day in 2027. This means that as long as transportation bottlenecks continue to ease, the balance sheet in 2027 will shift from "shortage" to "replenishment or even surplus."
Increased exports from the Atlantic Basin are a key variable suppressing the Brent crude spread and spot premium. The report notes that resilient production in the Americas and the release of strategic reserves jointly drove an increase of approximately 3.5 million barrels per day in exports to Eastern markets. The significance of this type of supply substitution lies not in daily volume, but in its weakening of the monopolistic power of geopolitical events on spot pricing.
Regarding changes in the Brent forward curve, the near-month contract is under pressure relative to the next-month contract, indicating a decrease in spot market tightness. Refineries and traders are no longer willing to pay a significant premium for immediate delivery. Morgan Stanley analyst Martijn Rats' team's assessment can be summarized in one sentence: setting aside narratives for now and looking solely at prices, the market has broadly weakened.
The latest weekly data from North America also shows uneven demand. As of the week ending June 19, refinery inputs were 17.1 million barrels per day, with an operating rate of 96.1%. However, the four-week average apparent gasoline demand was 8.8 million barrels per day, down 3.0% year-on-year; distillate fuel demand was 3.6 million barrels per day, up 3.2% year-on-year. Commercial crude oil inventories fell by 6.1 million barrels to 412.1 million barrels, about 7% below the five-year average, but gasoline inventories increased by 2.1 million barrels and distillate fuel inventories increased by 3.1 million barrels, reflecting that there was no simultaneous shortage of refined products.
This data explains why oil prices did not continue to rise despite the reduction in crude oil inventories: the decline in crude oil inventories was more driven by high refinery operating rates and export demand than by a comprehensive expansion in end-user consumption. If the crack spread for refined products cannot continue to widen, the high refinery operating rate itself could become a signal of overdrawn demand in the future.
On the daily chart, Brent crude is trading along the lower Bollinger Band, indicating that trend-following funds are still assessing volatility within a downward channel. The MACD DIFF is -6.55, DEA is -6.00, and the histogram remains negative, suggesting that momentum recovery is not yet complete. It's important to note that the price approaching the lower band does not automatically signify a reversal; rather, it represents the market entering a phase of "volatility compression within a weak trend."
The biggest disagreement right now isn't whether $73 per barrel is cheap, but whether the extent of supply recovery in 2027 can be absorbed by demand. If Gulf shipping continues to recover, North American exports remain high, and Asian refinery procurement recovers slowly, then $70 to $75 per barrel will become the new valuation center. Conversely, if the recovery of shipping routes falls short of expectations or refined product inventories decline rapidly again, then prices will re-incorporate a supply safety premium. Currently, the oil market has shifted from event-driven to balance sheet-driven.
The core reason for the decline in oil prices is not a cooling of sentiment, but rather the repricing of risk premiums.
Morgan Stanley lowered its oil price forecast for the second time in about two weeks, citing changes in key assumptions: a faster-than-expected recovery of traffic in the Strait of Hormuz and a reduced extreme tail risk of disruptions to Gulf exports. The bank lowered its Q3 and Q4 Dated Brent average price forecast to $75 per barrel and its year-end 2027 forecast to $70 per barrel. This is not simply a price correction, but rather a removal of the "supply unavailability premium" previously embedded in the price.
More importantly, the pullback in oil prices from above $126 a barrel in April to around $73 indicates that the market is no longer pricing in the worst-case scenario. If the supply curve recovers to about 65% of its pre-conflict level, it could cover approximately 11 to 12 million barrels per day of demand, and the supply panic would quickly translate into a reassessment of inventories, refinery margins, and forward curves.
The supply-side contradiction has shifted from a shortage narrative to export pressure.
The current oil market is not without supply risks, but the risk structure has changed. The International Energy Agency's June report projects that global oil demand will decline by 1.1 million barrels per day year-on-year in 2026, with global supply falling to 102.4 million barrels per day. However, supply may rebound by 8 million barrels per day to 110.3 million barrels per day in 2027. This means that as long as transportation bottlenecks continue to ease, the balance sheet in 2027 will shift from "shortage" to "replenishment or even surplus."
Increased exports from the Atlantic Basin are a key variable suppressing the Brent crude spread and spot premium. The report notes that resilient production in the Americas and the release of strategic reserves jointly drove an increase of approximately 3.5 million barrels per day in exports to Eastern markets. The significance of this type of supply substitution lies not in daily volume, but in its weakening of the monopolistic power of geopolitical events on spot pricing.
Weak demand is being reflected in the curve structure.
Regarding changes in the Brent forward curve, the near-month contract is under pressure relative to the next-month contract, indicating a decrease in spot market tightness. Refineries and traders are no longer willing to pay a significant premium for immediate delivery. Morgan Stanley analyst Martijn Rats' team's assessment can be summarized in one sentence: setting aside narratives for now and looking solely at prices, the market has broadly weakened.
The latest weekly data from North America also shows uneven demand. As of the week ending June 19, refinery inputs were 17.1 million barrels per day, with an operating rate of 96.1%. However, the four-week average apparent gasoline demand was 8.8 million barrels per day, down 3.0% year-on-year; distillate fuel demand was 3.6 million barrels per day, up 3.2% year-on-year. Commercial crude oil inventories fell by 6.1 million barrels to 412.1 million barrels, about 7% below the five-year average, but gasoline inventories increased by 2.1 million barrels and distillate fuel inventories increased by 3.1 million barrels, reflecting that there was no simultaneous shortage of refined products.
This data explains why oil prices did not continue to rise despite the reduction in crude oil inventories: the decline in crude oil inventories was more driven by high refinery operating rates and export demand than by a comprehensive expansion in end-user consumption. If the crack spread for refined products cannot continue to widen, the high refinery operating rate itself could become a signal of overdrawn demand in the future.
Technical indicators confirm weakness, but the real pricing anchor lies in the 2027 balance sheet.
On the daily chart, Brent crude is trading along the lower Bollinger Band, indicating that trend-following funds are still assessing volatility within a downward channel. The MACD DIFF is -6.55, DEA is -6.00, and the histogram remains negative, suggesting that momentum recovery is not yet complete. It's important to note that the price approaching the lower band does not automatically signify a reversal; rather, it represents the market entering a phase of "volatility compression within a weak trend."
The biggest disagreement right now isn't whether $73 per barrel is cheap, but whether the extent of supply recovery in 2027 can be absorbed by demand. If Gulf shipping continues to recover, North American exports remain high, and Asian refinery procurement recovers slowly, then $70 to $75 per barrel will become the new valuation center. Conversely, if the recovery of shipping routes falls short of expectations or refined product inventories decline rapidly again, then prices will re-incorporate a supply safety premium. Currently, the oil market has shifted from event-driven to balance sheet-driven.
- Risk Warning and Disclaimer
- The market involves risk, and trading may not be suitable for all investors. This article is for reference only and does not constitute personal investment advice, nor does it take into account certain users’ specific investment objectives, financial situation, or other needs. Any investment decisions made based on this information are at your own risk.