Gold falls below $4,000; where does the real damage come from?
2026-07-01 16:00:03
On Wednesday, July 1st, spot gold continued its weak recovery after a sharp drop. The daily chart shows the price hovering around $3970 per ounce, significantly below the Bollinger Band middle line at $4248.12 per ounce and close to the lower band at $3888.68 per ounce. Gold prices have retreated approximately 11.68% in the past month, but are still about 18.11% higher than a year ago. This suggests that the current decline is not an isolated fluctuation, but rather a repricing phase after falling from the year's highs.
The core reason for the current pressure on gold is not a single technical breakdown, but rather the repricing of interest rate expectations. The Federal Reserve's June meeting maintained the federal funds rate in the 3.50% to 3.75% range. Chairman Kevin Warsh emphasized at the press conference that the committee's goals remain price stability and full employment, and explicitly stated that inflation has been above the 2% target for more than five years. More importantly, Warsh downplayed forward guidance, meaning the market needs to directly repric based on employment, inflation, and bond yields, rather than waiting for the central bank to pave the way in advance.
This is unfavorable for gold. Gold doesn't offer coupons, and rising real and nominal interest rates will increase the cost of holding it. Cleveland Fed President Beth Hammark has previously stated that she is more concerned about the risk of persistently high inflation, and that if recent trends continue, policy action may be necessary. Such statements do not equate to an immediate rate hike, but they are enough to reduce bets on an easing trade.
From a cross-asset perspective, while gold fell below $4,000 per ounce, the US dollar index and US Treasury yields did not provide any buffer. On July 1st, the US dollar index rose to 101.35, up 0.19% on the day, and up approximately 2.17% over the past month. On the same day, the yield on the 10-year US Treasury bond remained around 4.47%. For traders, this combination is more important than a simple strengthening of the US dollar, because it means that both nominal yields and exchange rates are simultaneously compressing the valuation space for gold.
While risks associated with the Middle East conflict remain, marginal changes in news are no longer solely driving up safe-haven premiums. The market is focused on the progress of communications between the US and Iran; once the conflict premium declines, gold will more easily return to the pricing framework of interest-rate assets. In other words, safe-haven buying hasn't disappeared, but rather been offset by higher holding costs. The current weakness in gold prices lies in the shift in the macro narrative from "safe-haven asset" to "non-interest-bearing asset."
On the daily chart, the Bollinger Bands are trending downwards, with the middle band at $4248.12 per ounce acting as resistance, and the lower band at $3888.68 per ounce representing the trading range. The price is trading close to the lower band, indicating that the downtrend still has momentum, but it also suggests that short-term volatility may increase. If the price repeatedly fluctuates around the lower band, it doesn't necessarily mean the trend has reversed; it's more likely a consolidation phase after a sharp drop.
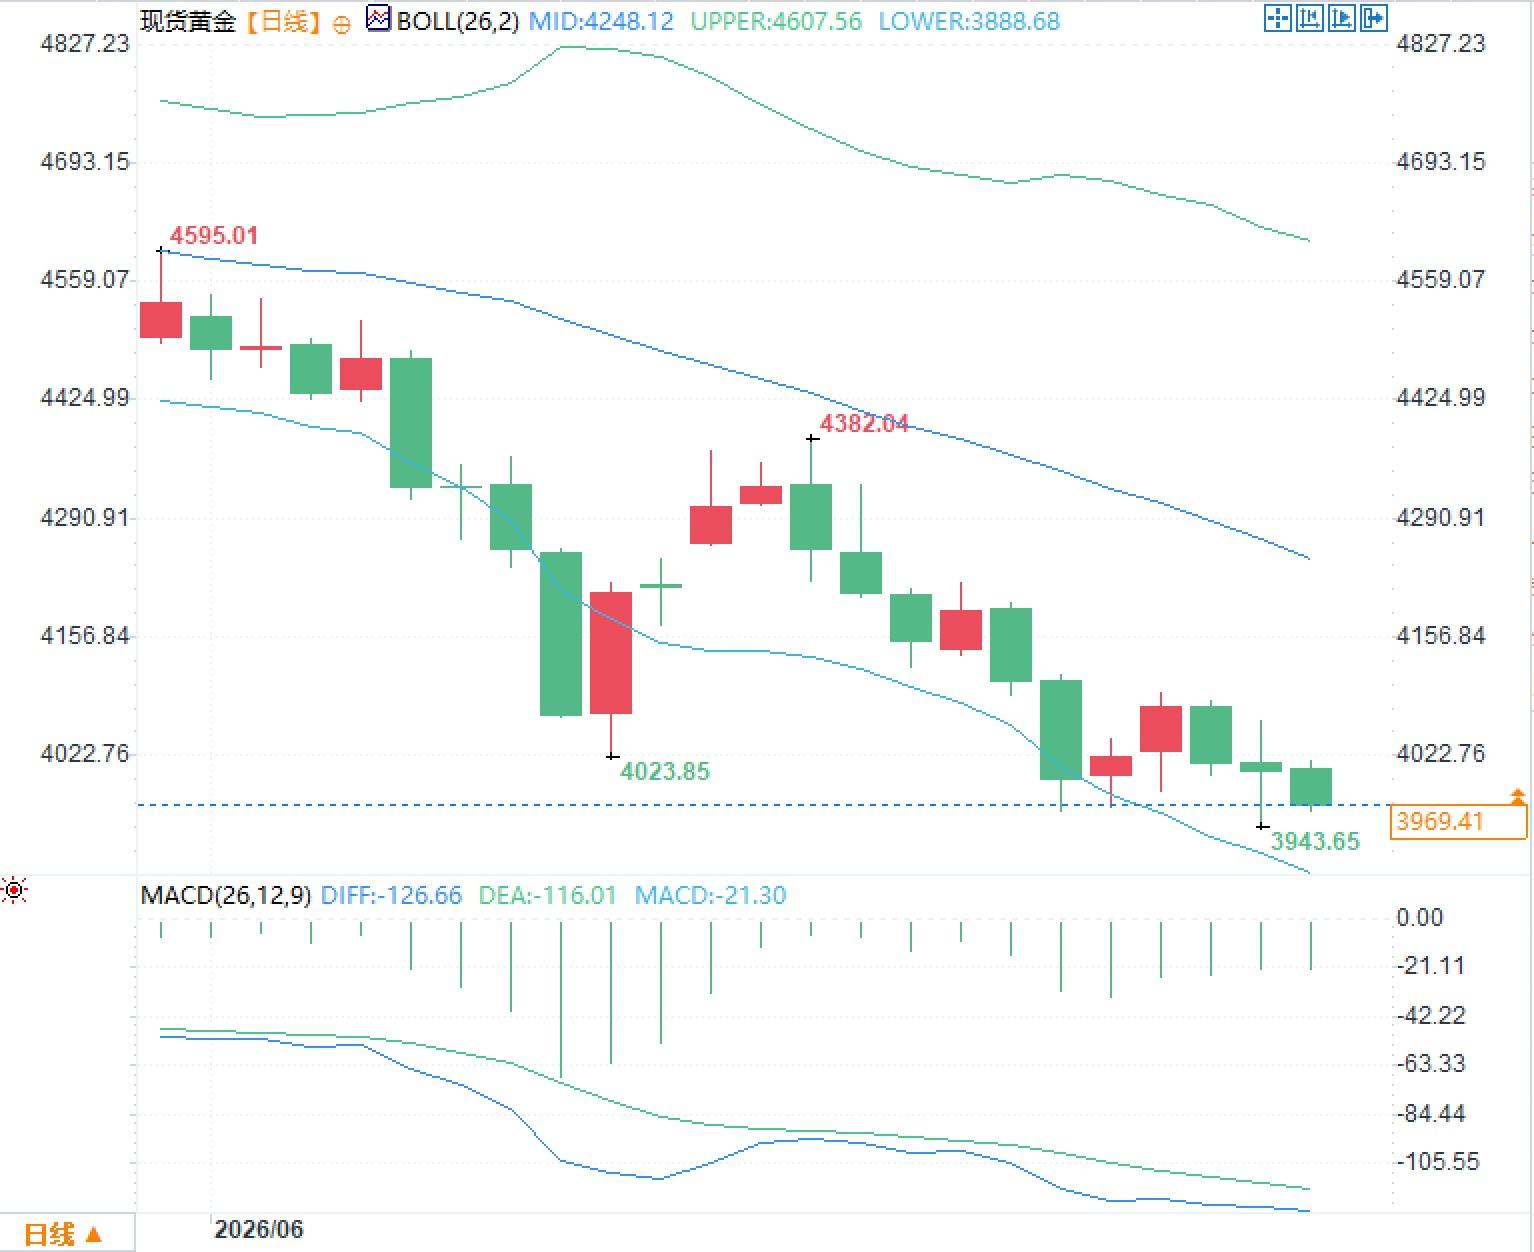
The MACD is also weak. In the chart, the DIFF is -126.66, the DEA is -116.01, and the MACD histogram is -21.30, all three below the zero line, indicating that medium-term momentum has not yet recovered. More importantly, the market is focused on a death cross signal, which essentially means the 50-day moving average crosses below the 200-day moving average, representing a shift in the medium-term price center of gravity towards the long-term price center of gravity. This signal does not guarantee continued decline, but it will change the risk budget of quantitative and trend-following funds.
The key issue for gold right now isn't whether it's $3970 or $4000 per ounce, but whether three variables can simultaneously ease. First, whether pricing in a September rate hike by the Federal Reserve continues to intensify. Market pricing once indicated a 67% probability of a September rate hike, which directly impacts gold's valuation anchor. Second, whether the US dollar index can hold above 101. If the dollar continues to strengthen, the cost of gold purchases by non-dollar funds will passively increase. Third, whether US Treasury yields will fall from around 4.47%. If yields remain high, the rebound potential of gold will be easily suppressed.
Gold prices fell by about 14% in the second quarter, a significant quarterly pullback rarely seen in recent years. Spot silver experienced an even deeper decline during the same period, indicating that the precious metals sector's decline was not a technical adjustment in a single commodity, but rather a result of combined pressure from falling interest rates, the US dollar, and risk premiums. For investors, gold still possesses long-term safe-haven appeal, but short-term pricing power has shifted from geopolitical news to interest rate paths. As long as the Federal Reserve maintains its "inflation first" communication framework, gold will find it difficult to escape the constraints of a high-interest-rate environment.
Interest rate expectations have once again become the main driver of gold pricing.
The core reason for the current pressure on gold is not a single technical breakdown, but rather the repricing of interest rate expectations. The Federal Reserve's June meeting maintained the federal funds rate in the 3.50% to 3.75% range. Chairman Kevin Warsh emphasized at the press conference that the committee's goals remain price stability and full employment, and explicitly stated that inflation has been above the 2% target for more than five years. More importantly, Warsh downplayed forward guidance, meaning the market needs to directly repric based on employment, inflation, and bond yields, rather than waiting for the central bank to pave the way in advance.
This is unfavorable for gold. Gold doesn't offer coupons, and rising real and nominal interest rates will increase the cost of holding it. Cleveland Fed President Beth Hammark has previously stated that she is more concerned about the risk of persistently high inflation, and that if recent trends continue, policy action may be necessary. Such statements do not equate to an immediate rate hike, but they are enough to reduce bets on an easing trade.
The US dollar and US Treasury yields are exerting dual pressure.
From a cross-asset perspective, while gold fell below $4,000 per ounce, the US dollar index and US Treasury yields did not provide any buffer. On July 1st, the US dollar index rose to 101.35, up 0.19% on the day, and up approximately 2.17% over the past month. On the same day, the yield on the 10-year US Treasury bond remained around 4.47%. For traders, this combination is more important than a simple strengthening of the US dollar, because it means that both nominal yields and exchange rates are simultaneously compressing the valuation space for gold.
While risks associated with the Middle East conflict remain, marginal changes in news are no longer solely driving up safe-haven premiums. The market is focused on the progress of communications between the US and Iran; once the conflict premium declines, gold will more easily return to the pricing framework of interest-rate assets. In other words, safe-haven buying hasn't disappeared, but rather been offset by higher holding costs. The current weakness in gold prices lies in the shift in the macro narrative from "safe-haven asset" to "non-interest-bearing asset."
Technical analysis indicates the trend has not yet fully recovered.
On the daily chart, the Bollinger Bands are trending downwards, with the middle band at $4248.12 per ounce acting as resistance, and the lower band at $3888.68 per ounce representing the trading range. The price is trading close to the lower band, indicating that the downtrend still has momentum, but it also suggests that short-term volatility may increase. If the price repeatedly fluctuates around the lower band, it doesn't necessarily mean the trend has reversed; it's more likely a consolidation phase after a sharp drop.
The MACD is also weak. In the chart, the DIFF is -126.66, the DEA is -116.01, and the MACD histogram is -21.30, all three below the zero line, indicating that medium-term momentum has not yet recovered. More importantly, the market is focused on a death cross signal, which essentially means the 50-day moving average crosses below the 200-day moving average, representing a shift in the medium-term price center of gravity towards the long-term price center of gravity. This signal does not guarantee continued decline, but it will change the risk budget of quantitative and trend-following funds.
What traders really need to focus on is not single price levels.
The key issue for gold right now isn't whether it's $3970 or $4000 per ounce, but whether three variables can simultaneously ease. First, whether pricing in a September rate hike by the Federal Reserve continues to intensify. Market pricing once indicated a 67% probability of a September rate hike, which directly impacts gold's valuation anchor. Second, whether the US dollar index can hold above 101. If the dollar continues to strengthen, the cost of gold purchases by non-dollar funds will passively increase. Third, whether US Treasury yields will fall from around 4.47%. If yields remain high, the rebound potential of gold will be easily suppressed.
Gold prices fell by about 14% in the second quarter, a significant quarterly pullback rarely seen in recent years. Spot silver experienced an even deeper decline during the same period, indicating that the precious metals sector's decline was not a technical adjustment in a single commodity, but rather a result of combined pressure from falling interest rates, the US dollar, and risk premiums. For investors, gold still possesses long-term safe-haven appeal, but short-term pricing power has shifted from geopolitical news to interest rate paths. As long as the Federal Reserve maintains its "inflation first" communication framework, gold will find it difficult to escape the constraints of a high-interest-rate environment.
- Risk Warning and Disclaimer
- The market involves risk, and trading may not be suitable for all investors. This article is for reference only and does not constitute personal investment advice, nor does it take into account certain users’ specific investment objectives, financial situation, or other needs. Any investment decisions made based on this information are at your own risk.